
Figure 3.
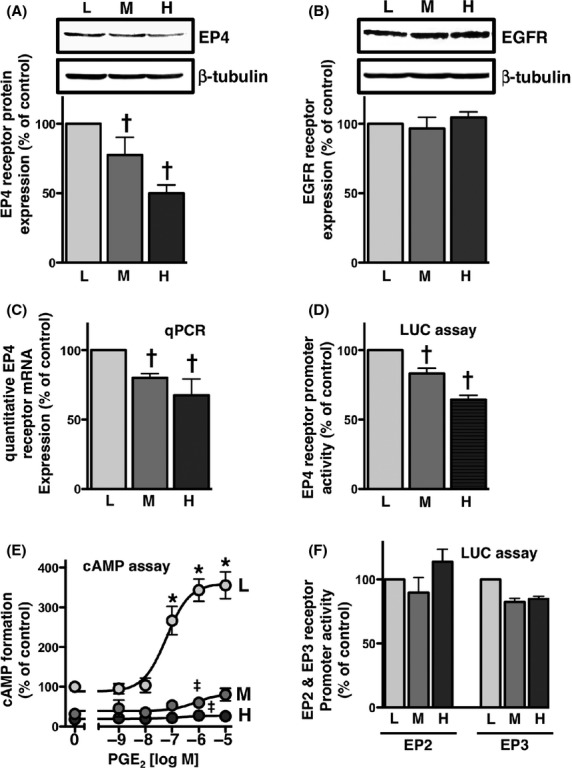
EP4 receptors were down-regulated in a cellular density-dependent manner in HCA-7 cells. Cells were cultured at low (L; 3 × 10⁴ cells/each 6 well), middle (M; 1 × 10⁵ cells/each 6 well), and high (H; 3 × 10⁵ cells/each 6 well) densities. Each cellular density was then subjected to immunoblot analysis with an antibody against EP4 (A) or EGFR (B), quantitative PCR (C), the EP4 promoter-luciferase assay (D), PGE2-stimulated cAMP assay (E), or EP2 or EP3 promoter-luciferase assay (F), as described in the Materials and Methods. (A, B) The blots were stripped and re-probed with an antibody against β-tubulin. The bar graphs represent the ratio of COX-2 to β-tubulin as assessed with pooled densitometric data (mean ± SD) from more than three independent experiments. Data are normalized to the ratio of COX-2 to β-tubulin at the low cellular density as 100%. (C) The RNA of HCA-7 cells at each cellular density was isolated and used for quantitative real-time PCR with primers specific for either human EP4 or GAPDH, as described in the Materials and Methods. Data were analyzed by comparative methods relative to the expression of GAPDH and were normalized to the results obtained at the low cellular density as 100%. Data are the mean ± SD from three independent experiments. (D, F) Each cellular density was transiently transfected with human EP4 receptor promoter- (D), human EP2 promoter-, or EP3 promoter- (F) responsive luciferase reporter genes and control pRL-CMV or pGL3-CMV plasmids, and luciferase activity was determined as described in the Materials and Methods. Data were analyzed by comparative methods relative to the results of control luciferase activity levels, and were normalized to the results obtained at the low cellular density as 100%. Data are the mean ± SD from three independent experiments. (E) Each cellular density was treated with the indicated concentrations of PGE2 for 60 min. cAMP formation was determined as described in the Materials and Methods. Data are the means ± SEM of three independent experiments, with each being performed in duplicate. Data were normalized to the vehicle-treated control at the low cellular density as 100%. *P, †P < 0.05, ANOVA, significantly different from the vehicle-stimulated HCA-7 cells at the low cellular density. ‡P < 0.05, ANOVA, significantly different from PGE2-stimulated HCA-7 cells at the low cellular density (the analyzed results were shown for 1 μmol/L PGE2 only).