
Figure 3.
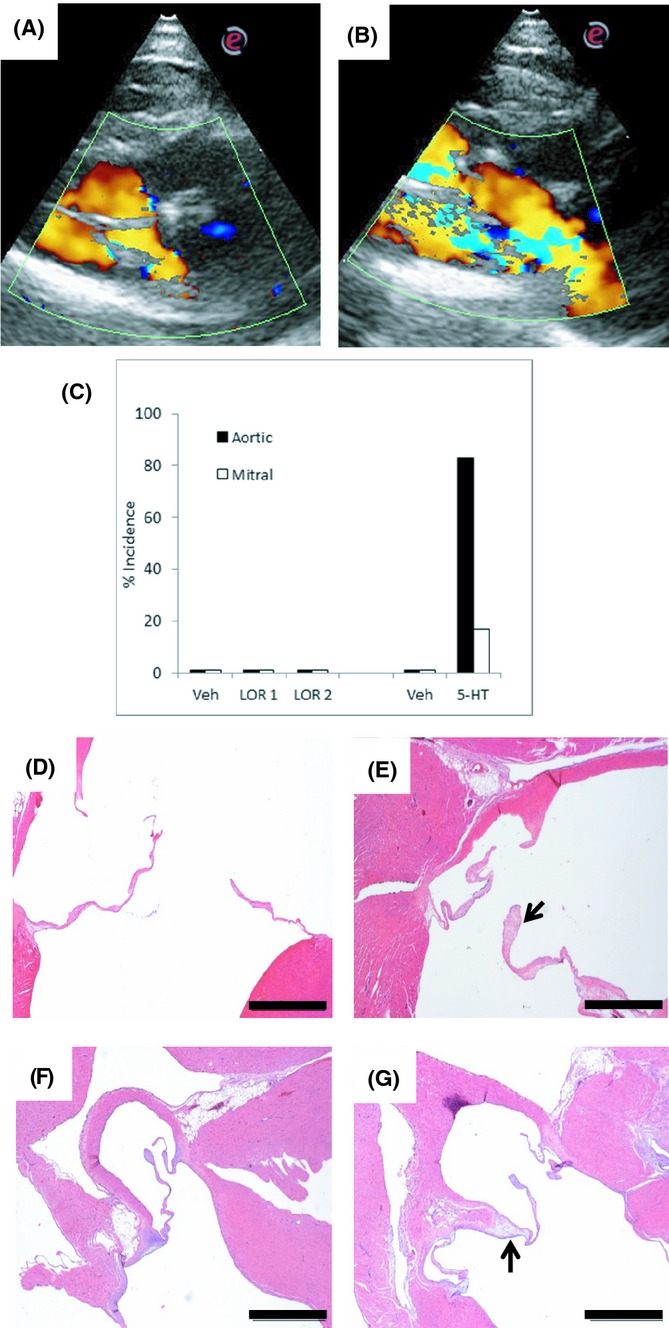
Representative echocardiographic images showing normal flow through the aortic valve with normal antegrade flow represented in yellow (A) and turbulent regurgitant flow in blue in an abnormal valve (B). Image (A) was taken from a vehicle-treated rat, (B) from a 28 day 5-HT-treated rat. (C) Graph to summarize the percent incidence of regurgitant flow across the aortic and mitral valves from all study animals. (D) Normal aortic valve, taken from a lorcaserin vehicle control rat fed high-fat diet. (E) Aortic valve, taken from a lorcaserin vehicle control rat fed high-fat diet. Note the mild multifocal thickening of valve spongiosa by moderately cellular myxomatous and collagenous matrix. (F) Normal aortic valve, taken from a vehicle control rat fed regular diet. (G) Aortic valve, taken from a 28 day 5-HT-treated rat fed regular diet. The arrow denotes expansion of spongiosa at base of valve cusp by myxomatous stroma. Scale bar = 1 mm.