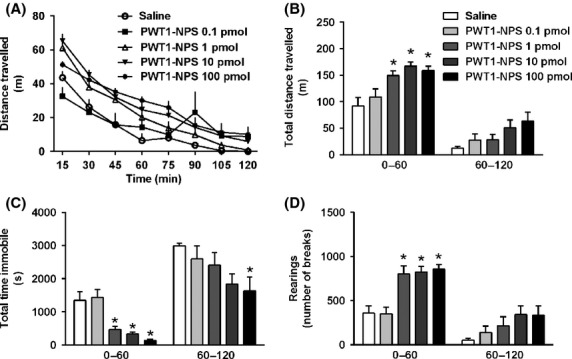
Figure 5.

Mouse locomotor activity test. Dose–response curve to PWT1-NPS (0.1–100 pmol, i.c.v., 15 min before starting the test). Time course of the distance travelled is shown in panel A. According to one-way ANOVA followed by the Dunnett’s post hoc test, PWT1-NPS elicited a statistically significant effect on the cumulative distance travelled (F(4,32) = 7.95 0–60 min, B), total time immobile (F(4,32) = 13.49 0–60 min; F(4,32) = 2.70 60–120 min, C), and number of rearings (F(4,32) = 12.20 0–60 min, D). Data are mean ± SEM of 7–8 mice per group, *P < 0.05 vs. saline.
