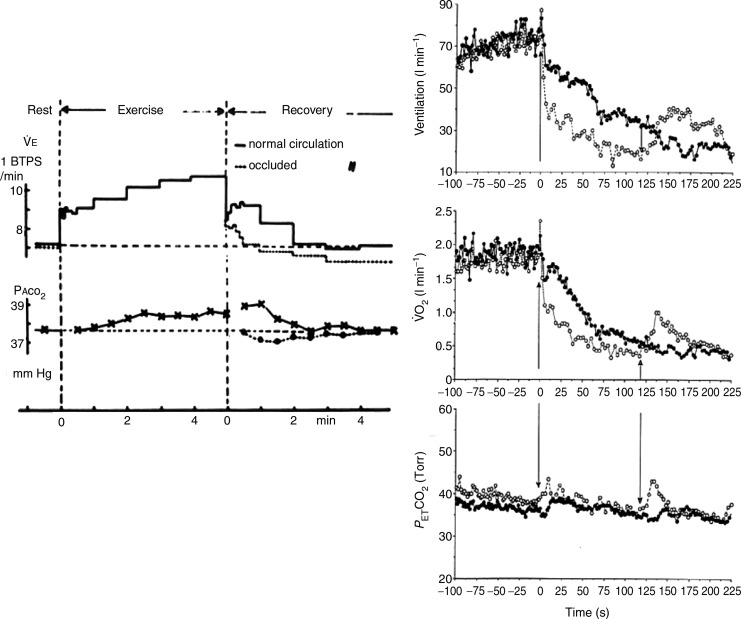
Figure 5.
Left panel: example of the breath-by-breath minute ventilation ( E), and alveolar
  during recovery from a light level of exercise with intact circulation and while impeding the circulation to the post-exercising legs (Dejours et al. 1990). Right panel: Minute ventilation (
 E), O2 uptake (
 ), and end-tidal
  (
( ) during recovery (filled symbols) from a constant work rate cyclo-ergometer exercise performed above the lactate threshold and during recovery with cuffs inflated for 2 min around the upper thigh (open symbols) (adapted from Haouzi et al. 1997). The first arrow indicates the cessation of exercise and cuff inflation; the second arrow indicates the moment of occlusion release. Note that in both studies, the normal ventilatory decline was depressed during cuff occlusion, resulting a large ventilatory deficit, despite expected accumulation of metabolites in the muscle circulation.

