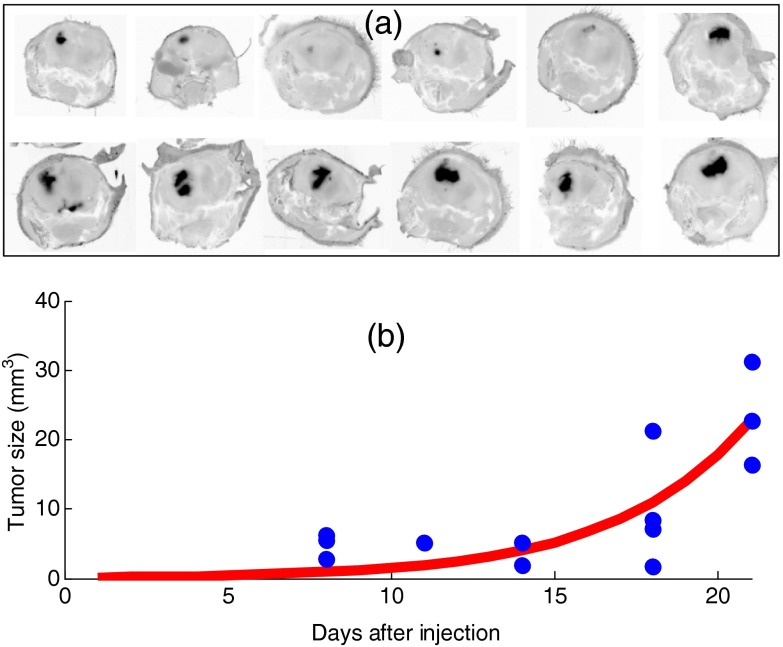
Fig. 3.
(a) Fluorescence images of green fluorescent protein (GFP) distribution within cryosectioned cranium samples are shown for 12 mice, showing the range of tumor sizes in the study. (b) The tumor volume over time was estimated by magnetic resonance imaging scans and is shown for each of the mice imaged, illustrating the expected average orthotopic glioma tumor growth curve with time after implantation for this cell line.

