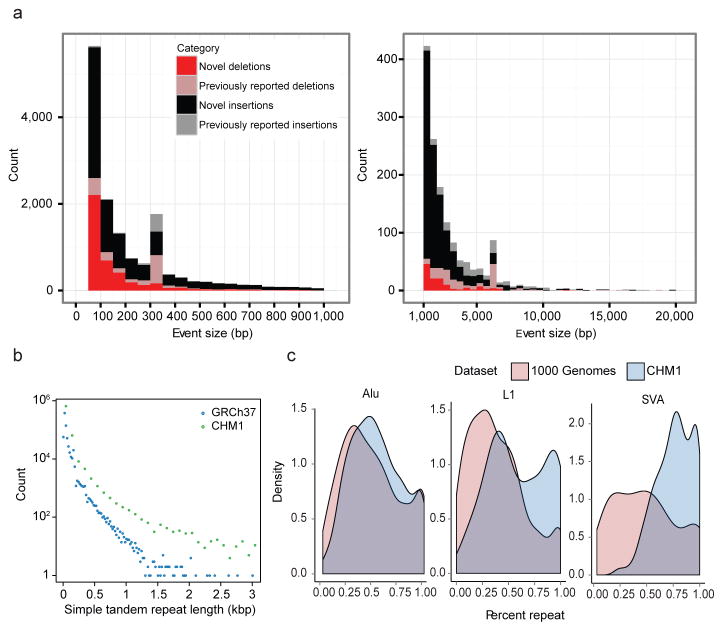
Figure 2. Structural variation analyses.
a, Histograms display the distribution of novel insertions (black/grey) and deletions (red/pink) between CHM1 and GRCh37 haplotypes compared to copy number variants (CNVs) identified from other studies. Most of the increased sensitivity occurs below 5 kbp. Peaks at ~300 and 6 kbp correspond to Alu and L1 insertions, respectively. b, STR insertions in CHM1 (green) are longer when compared to the human genome (blue) and this effect becomes more pronounced with increasing length (x-axis). c, The percent repeat composition (x-axis) of 1 kbp sequences flanking insertion sites for Alu, L1, and SVA MEIs. Insertion calls from the 1000 Genomes Project (light red)21 compared to calls from CHM1 using PacBio reads (blue) show increased sensitivity for repeat-rich insertions.

