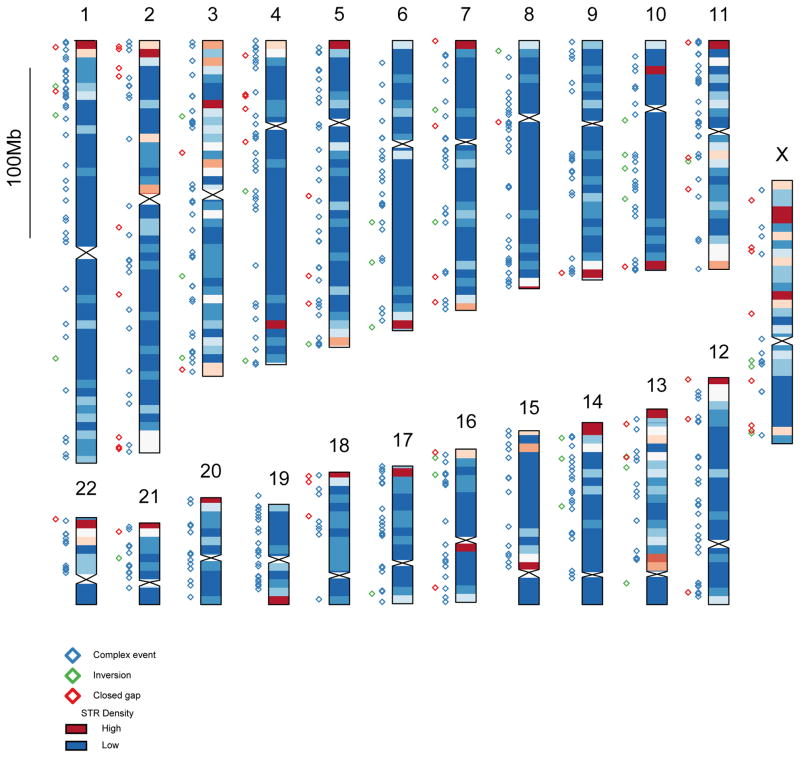
Extended Data Figure 3. Genome distribution of closed gaps and insertions.
Chromosome ideogram heatmap depicts the normalized density of inserted CHM1 basepairs per 5 Mbp bin with a strong bias noted near the end of most chromosomes. Locations of SVs and closed gaps are given by colored diamonds to the left of each chromosome: closed gap sequences (red), inversions (green), and complex gaps (blue).

