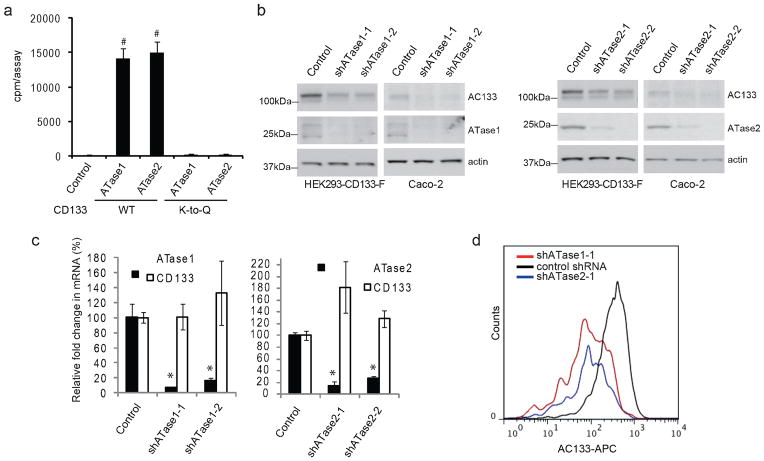
Figure 4. ATase1 and ATase2 regulate CD133 stability.
a) An in vitro acetylation assay was performed as previously described (6). Briefly, affinity-purified wild-type or K-to-Q mutant CD133 was incubated with [3H]acetyl-CoA (American Radiolabeled Chemicals) in the presence of the acetyl-CoA:lysine acetyltransferase, ATase1 or ATase2, purified using the ProFound kit (Pierce-Thermo Scientific). The reaction was performed in 200 μl of acetylation buffer (50 mM Tris-HCl (pH 8.0), 0.1 mM EDTA, 1 mM dithiothreitol, 10% glycerol, 20 μM acetyl-CoA) for 1 h at 30°C. The reaction was stopped by adding an equal volume of ice-cold acetylation buffer and immediate immersion in ice. Following the reaction, CD133 was immunoprecipitated using anti-FLAG magnetic beads (Sigma-Aldrich) and then counted on a liquid scintillation counter. As a control, CD133 was incubated with [3H]acetyl-CoA in the absence of the enzyme (ATase1 or ATase2). Error bars represent the standard deviation of three independent replicates (n=3). b) HEK293/CD133-F and Caco-2 cells were treated with two independent shRNAs targeting either ATase1 (shATase1-1: TRCN0000035450, ATase1-2:TRCN0000035451, Sigma-Aldrich Inc.) or ATase2 (shATase2-1: TRCN000035564 and shATase2-2: TRCN0000035568 Sigma-Aldrich Inc). Lentiviral production and infection was performed as previously described (3). Lysates were analyzed by immunoblotting for CD133 using the anti-AC133 antibody. ATase1 and ATase2 knockdown at the protein level was monitored by immunoblotting using the anti-NAT8 (Ap4967c, Abgent Inc.) and anti-NAT8B (ab97885, Abcam Inc.) antibodies. Immunoblotting of actin was used as loading control. c) ATase1, ATase2, and CD133 transcript levels were monitored by quantiative PCR in the presence of shATase1 and shATase2 knockdown using primers for ATase1 or ATase2 (6). Transcript levels were normalized to actin and are relative to the control shRNA. Error bars represent the standard deviation of four independent replicates (n=4). *p<0.05, #p<0.01. p-value was calculated against the control using a two-tailed Student’s t-test. d) FACS analysis of Caco-2 cells transduced with either a control shRNA, shATase1-1 or shATase2-1. Cell staining for flow cytometry and analysis was performed as previously described (9).

