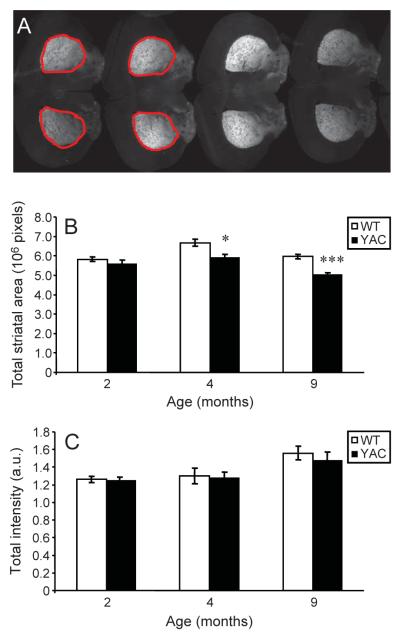
Fig. 6.
Quantification of striatal morphology in YAC and WT mice. A, Representative scans of coronal section analyzed by MetaXpress software. The region of interest was selected manually and is shown by red line on 4 slices on the left. B, C The average striatal volume (B) and total EGFP fluorescence (C) for WT mice at 2 months (n = 7), 4 months (n = 6) and 9 months (n = 9) of age are shown as mean ± SEM (open bars). The average surrogate striatal volume (B) and total EGFP fluorescence (C) for YAC mice are shown at 2 months (n = 7), 4 months (n = 6) and 9 months (n = 15) of age as mean SEM (filled bars). *p < 0.05; ***p < 0.001.

