
Figure 2.
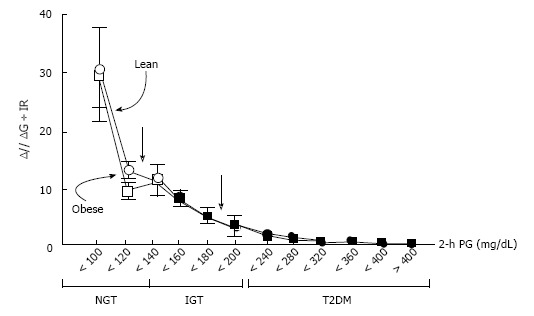
Insulin secretion/insulin resistance (disposition) index (I/G ÷ IR) during 75g-oral glucose tolerance test in individuals with normal glucose tolerance, impaired glucose tolerance, and type 2 diabetes as a function of the 2 h plasma glucose concentration in lean and obese subjects. I/G: Insulinogenic index (Insulin 0-30 min/Glucose 0-30 min); IR: Homeostasis model assessment of insulin resistance [HOMA-IR; fasting insulin (mU/L) x glucose (mmol/L)/22.5]. Adapted from ref.[9]. NGT: Normal glucose tolerance; IGT: Impaired glucose tolerance; T2DM: Type 2 diabetes; PG: Plasma glucose.