
Figure 3.
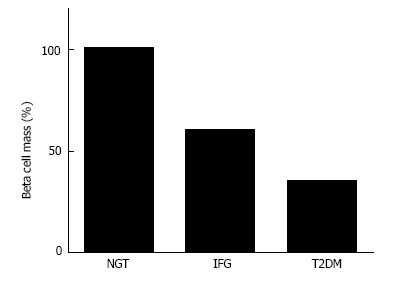
β-cell mass in patients with normal glucose tolerance, impaired fasting glycemia and type 2 diabetes. Adapted and modified from the study by Butler et al[12]. NGT: Normal glucose tolerance; IFG: Impaired fasting glycemia; T2DM: Type 2 diabetes.