
Figure 4.
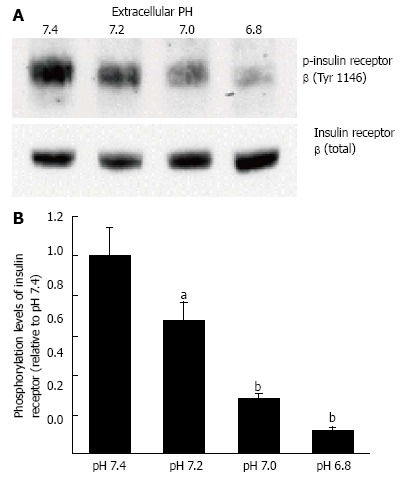
Phosphorylation levels of insulin receptor. After serum starvation for 4 h, L6 myotubes were treated with 100 nmol/L insulin for 15 min in the buffer with different pH. Total cell lysates were isolated and analyzed by Western blotting with indicated antibodies. A: Representative blots are shown; B: The quantative values of expression of insulin receptor using densitometry from 6 independent experiments using anti-phosphorylated-insulin receptor-β (Tyr 1146) antibody normalized to the level of total insulin receptor compared with that in pH 7.4 buffer. The values are shown as the mean ± SEM (n = 6). aP < 0.05, bP < 0.01 vs pH 7.4. Modified from ref.[46] with allowance of non-profit use of figures.