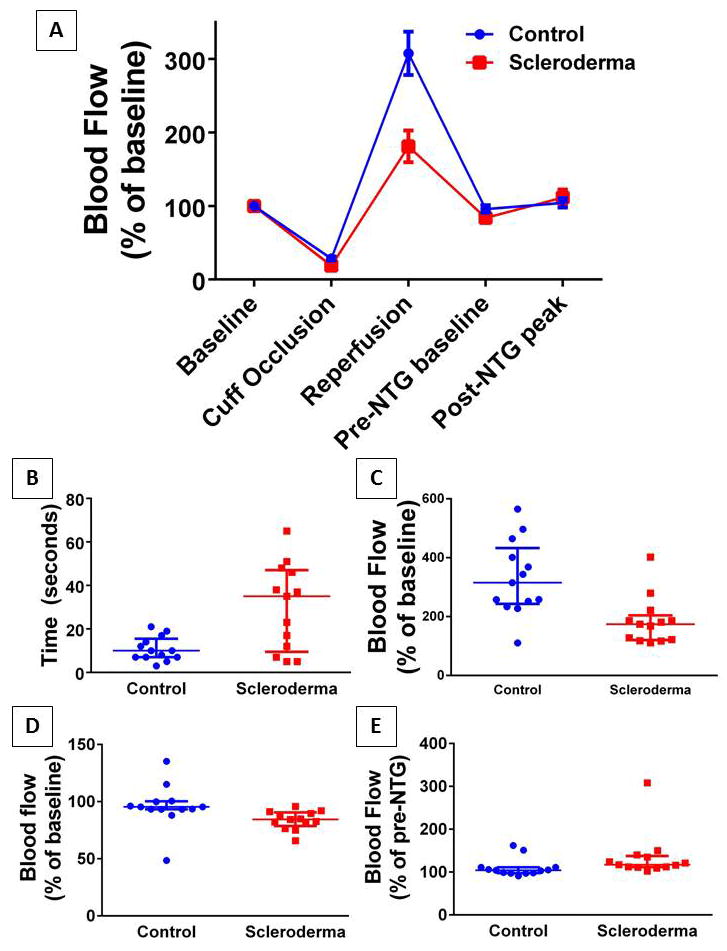
Figure 1. Changes in microvascular blood flow using laser speckle contrast imaging (LSCI).

LSCI obtained continuous blood flow measurements in systemic scleroderma patients or matched controls during the course of the experimental protocol (summarized in A). All values were normalized to the mean baseline blood flow arbitrary units per group resulting in both groups beginning at 100% flow. Each dot represents a subject and the bars represent the median and interquartile range. Groups differed significantly in the median time required to reach peak post-occlusive reactive hyperemia (B; p=0.019) as well as the maximum blood flow reached (C; p=0.002). In addition scleroderma patients had a post-occlusive blood flow nadir which was less than baseline and significantly lower than controls (D; p=0.001) and a larger response to sublingual nitroglycerin (E; p=0.007).
