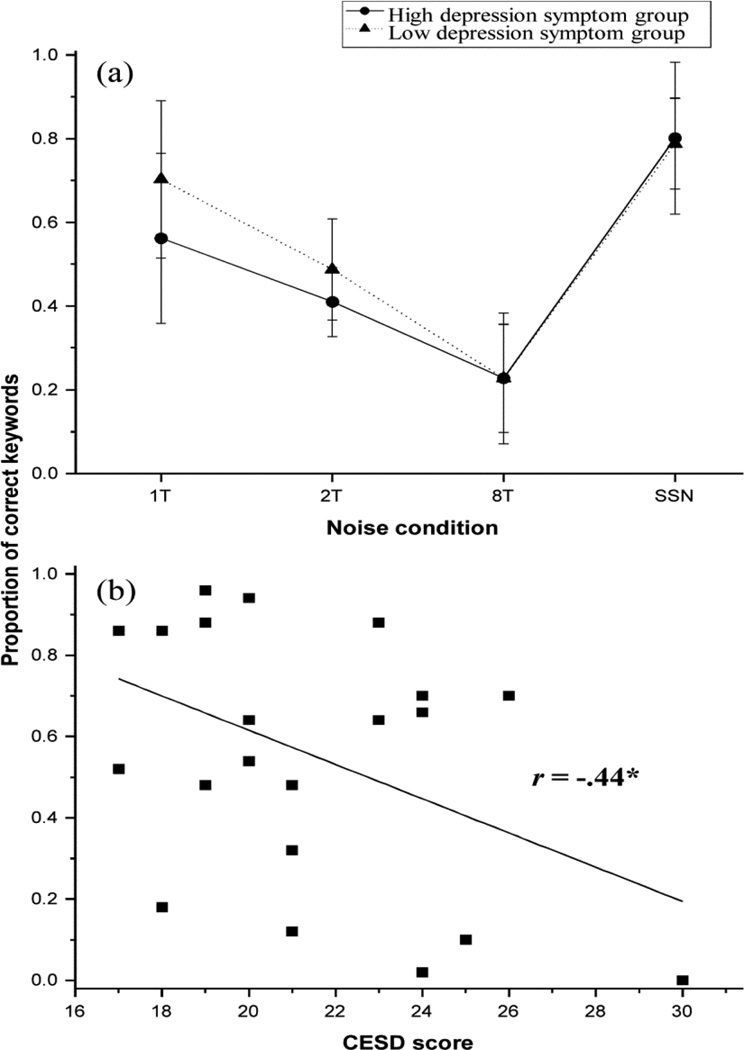
Figure 2.
(a) Proportion of correctly identified keywords across the four noise conditions (i.e., 1- talker babble, 2-talker babble, 8-talker babble, and SSN) in the groups with high (solid line) and low (dash line) depressive symptoms. Error bars represent standard deviation. (b) Proportion of correctly identified keywords in the 1-talker babble condition as a function of the extent of depressive symptoms indicated by CES-D score in the high depressive symptom group. The straight line represents the best-fitting line for the data points. r represents the correlation coefficient between proportion of correctly identified keywords and CES-D score. * denotes p < .05.

