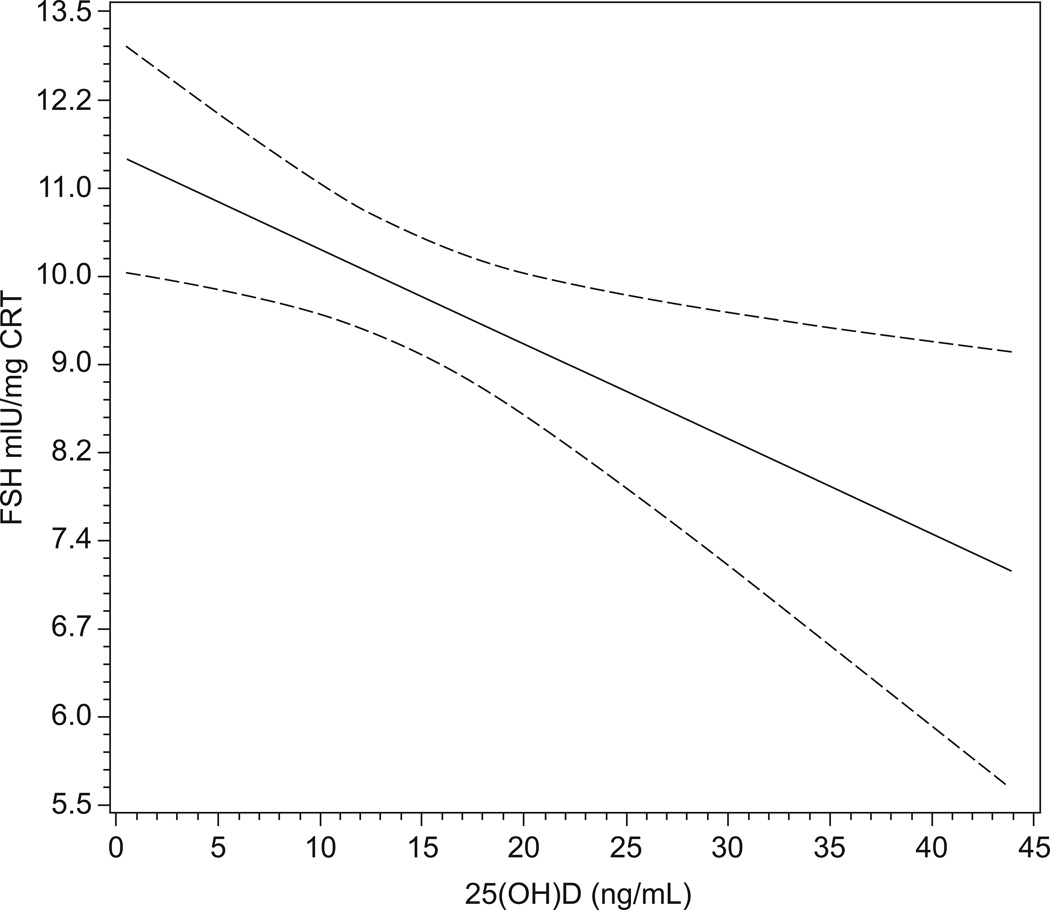
Figure 3.
Results of the unadjusted linear regression model of 25(OH)D predicting the natural log of FSH (solid line) (and predicted 95% confidence bands (dotted lines)) among 436 women who collected urine on cycle days 2 and 3 of the menstrual cycle. The y-axis tick marks are spaced on the natural log scale, but labeled on the absolute scale, for ease of interpretation.

