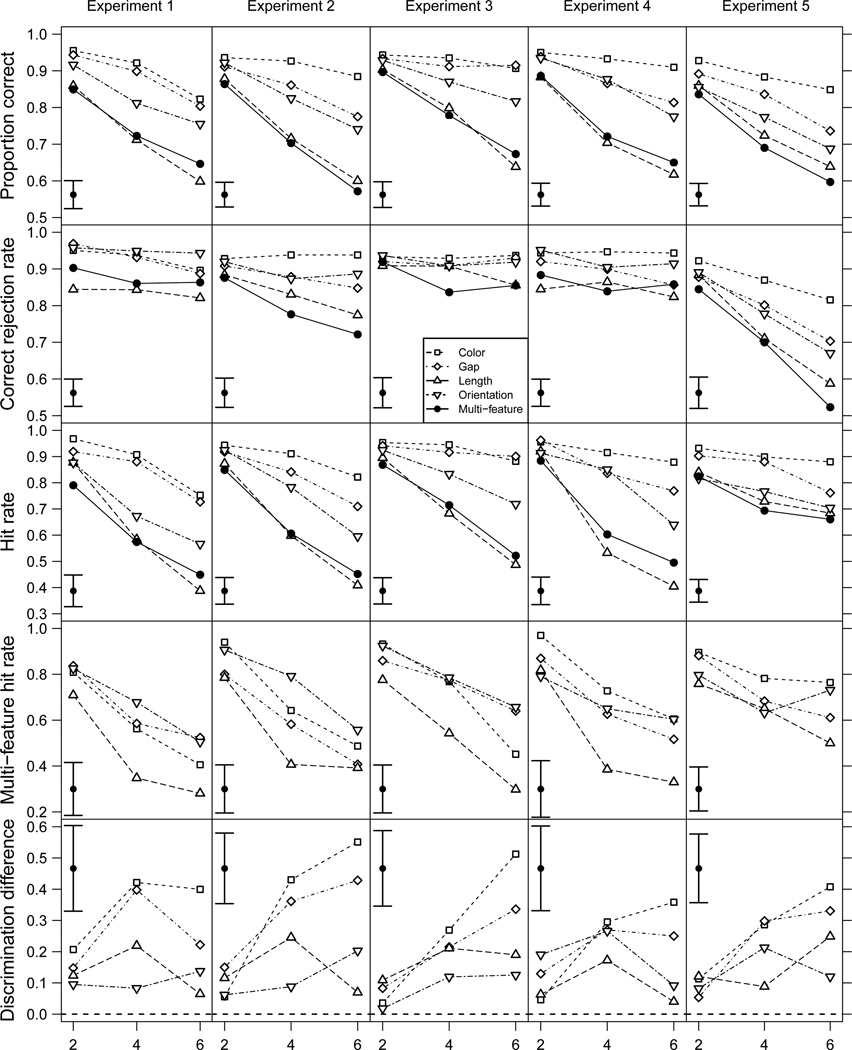
Figure 2.
Plots of data from Experiments 1 to 5. Array size is plotted on the X-axis. Rows of panels, from top to bottom, show overall proportion correct on the task, correct rejection rate, hit rate, hit rate for each feature within the multi-feature condition, and change discrimination difference for each feature (see the results section of Experiment 1 for more detail). Note that the scale of the Y-axis varies. In a corner of each panel is an error bar showing a 95% repeated measures confidence interval (see Hollands and Jarmasz, 2010 for a summary of the method) that applies to each data point in the panel. The legend applies to all panels in the figure.

