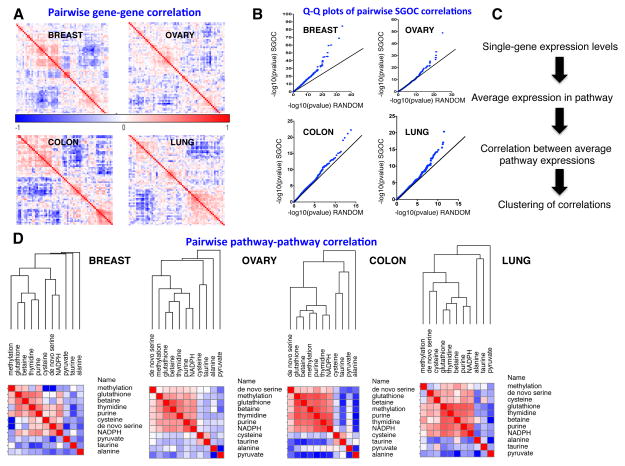
Figure 3. Correlations across reaction paths in the SGOC network.
A.) Hierarchically-clustered similarity matrices for four cancer types based on pairwise Spearman correlations. Modularity in the co-expression network is apparent. B.) Overview of algorithm that collapses co-regulated genes into reaction paths. C.) Quantile-Quantile (QQ) plots showing p-values from gene-gene spearman correlations in SGOC compared to randomly chosen pair of genes. D.) Correlations in expression of transcripts in one pathway in reference to another. Results are organized by hierarchical clustering using Spearman correlations in linkage similarities.

