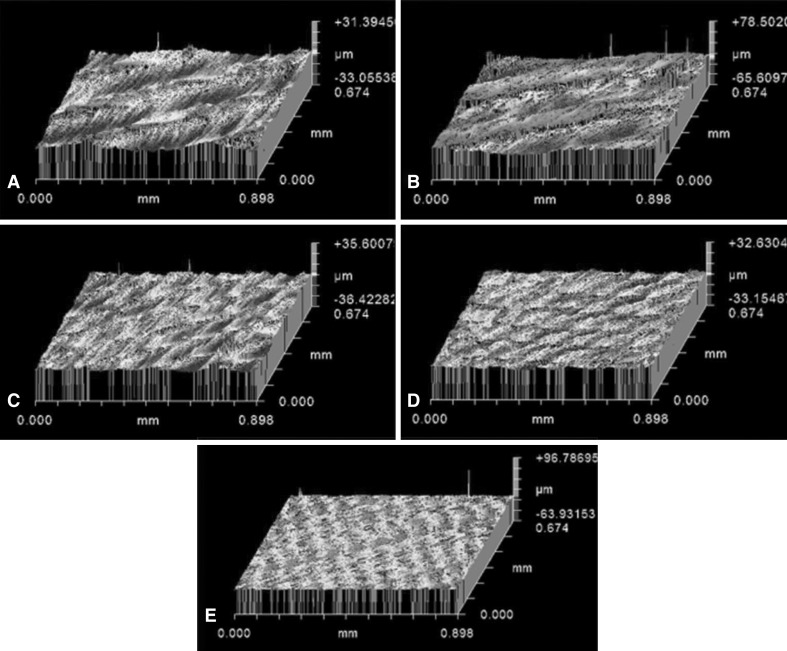
Fig. 4A–E.
Representative images of surface roughness (Ra) output for each of the five material types imaged by optical profilometry are shown: (A) HXL, (B) CM, (C) HXL VE 75 kGy, (D) HXL VE 150 kGy, and (E) PEEK. The CM material had the greatest surface roughness whereas the PEEK material had the least surface roughness.

