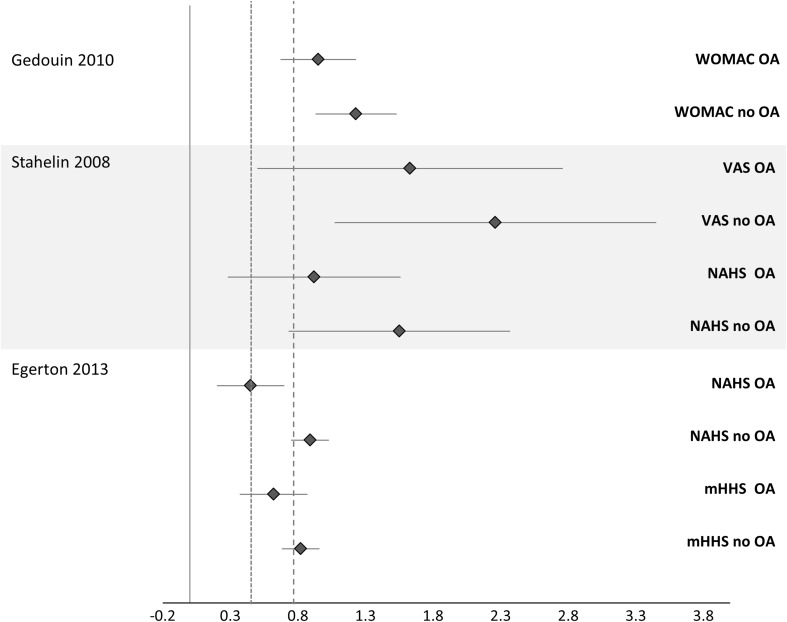
Fig. 3.
Effect sizes (studies that reported sufficient data) compare outcomes between people with and without hip OA. A positive CI favors the postoperative time point; a dashed line represents large effect size > 0.8; and a dotted line represents moderate effect size > 0.5. VAS = visual analog scale.

