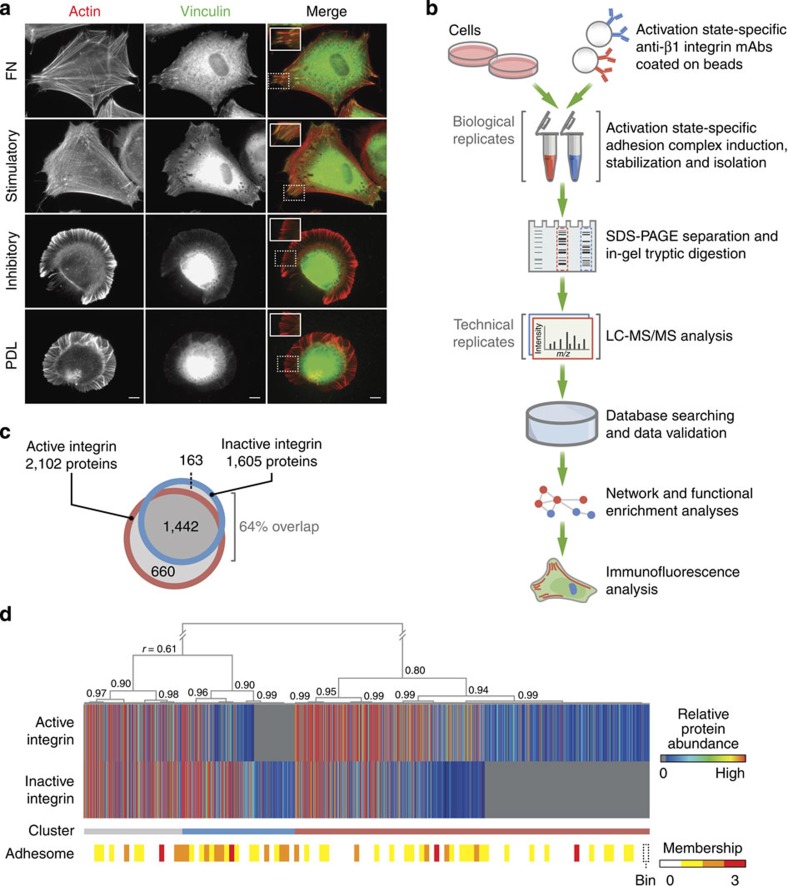
Figure 1. Proteomic analysis of integrin activation state-dependent adhesion complexes.
(a) Immunofluorescence microscopy revealed the morphology of HFF cells spread on stimulatory and inhibitory anti-β1 integrin mAbs compared with those spread on FN and PDL. Cells were stained for actin (red) and vinculin (green). Scale bar, 10 μm. Inset images correspond to areas highlighted in white dotted boxes. (b) Workflow for the isolation and proteomic analysis of integrin activation state-dependent adhesion complexes from K562 cells using paramagnetic beads coated with activation state-specific anti-β1 integrin mAbs. The mAb-coated beads recruited integrins and associated proteins in live cells, and complexes were then stabilized with crosslinker and crosslinks cleaved under reducing conditions during extraction. Proteins were then separated by SDS–PAGE, and the whole lane was cut into 30 slices, which were subjected to in-gel trypsin digestion for analysis by MS. MS data for each adhesion complex isolation were acquired in technical duplicate, from duplicate biological isolations. (c) The distribution of proteins identified in active and inactive integrin data sets illustrated as a Venn diagram. (d) Hierarchical clustering analysis of the quantitative MS data. Pearson correlation coefficients (r) are indicated at dendrogram nodes; a threshold of r≥0.80 was used to identify clusters of distinct protein enrichment (red, active integrin; blue, inactive integrin; grey, unenriched). Accompanying heat bar (bottom) indicates the distribution of reported adhesome components4. Bin, 20 proteins.

