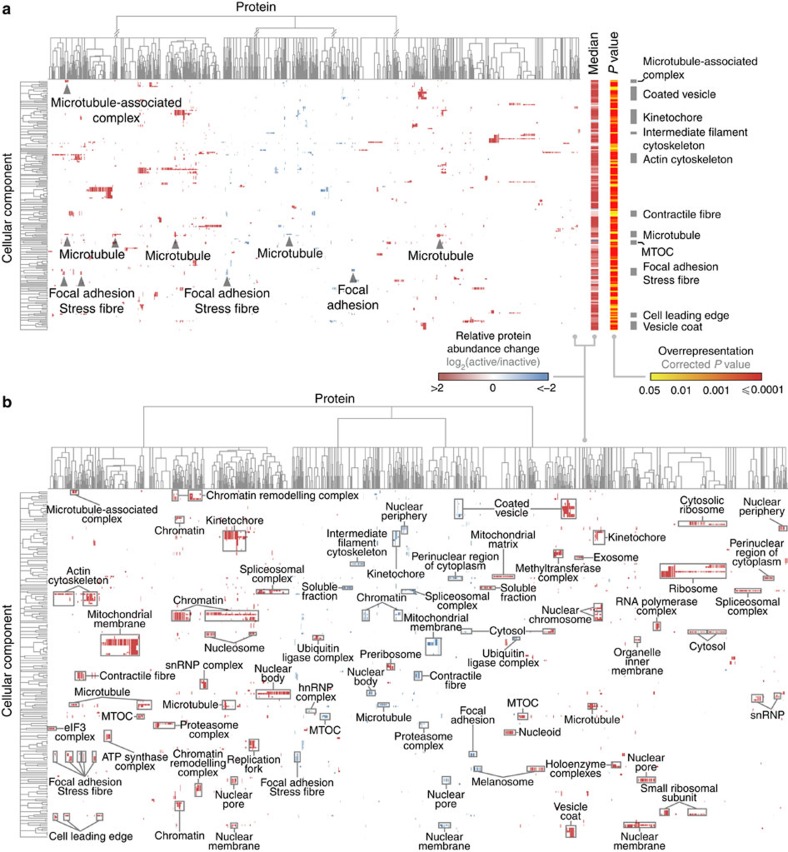
Figure 3. Functional enrichment map of the adhesion complex landscape.
(a) Overrepresented cellular component terms from proteins identified by MS were hierarchically clustered according to protein enrichment in active (red) or inactive (blue) integrin complexes. This identified clusters of similarly enriched proteins associated with a similar set of functional terms. Arrowheads indicate clusters of proteins assigned focal adhesion and microtubule-associated terms. Accompanying heat bars (right) indicate median protein enrichment (log2 transformed) and false discovery rate-corrected P value (all <0.05; log10 scale) for each cellular component term. Grey bars (right) highlight focal adhesion and cytoskeleton terms. (b) Additional annotation of the cellular component terms on the functional enrichment map in a revealed the range and specificity of cellular localizations reported for proteins enriched in active and inactive integrin complexes. Clusters containing at least eight proteins were labelled in addition to the cell adhesion terms highlighted in a. MTOC, microtubule-organizing centre; snRNP, small nuclear ribonucleoprotein.

