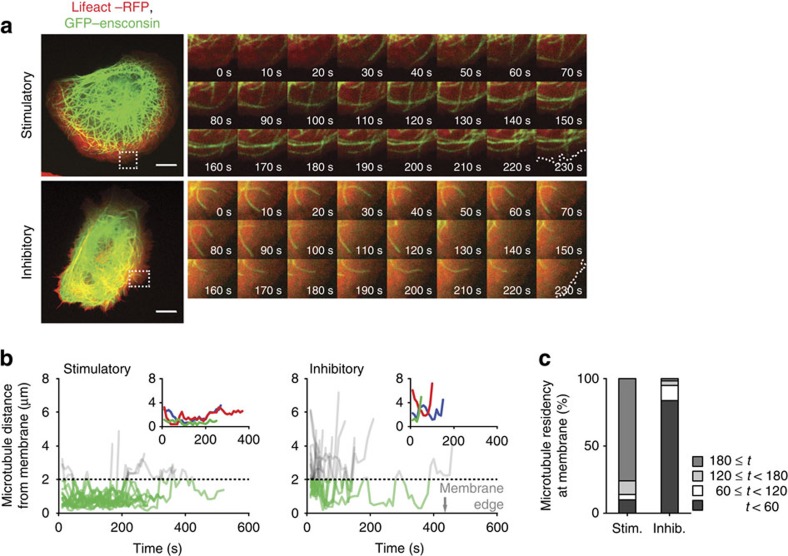
Figure 6. Active integrin creates an environment that stabilizes microtubules at the cell cortex.
(a) U2OS cells expressing Lifeact–RFP (red) and GFP–ensconsin (green) to visualize actin and microtubules, respectively, were spread on stimulatory and inhibitory mAbs, and microtubule dynamics were tracked by live confocal microscopy. Scale bars, 10 μm. Sequences of images (right panels) correspond to areas highlighted in white dotted boxes (left panels) recorded over a period of 230 s (one image acquired every 10 s; see Supplementary Movies 1 and 2). White dotted line in final image of each sequence indicates the cell periphery as defined by the actin channel. (b) The distance between microtubule tips and the cell edge over the lifetime of each microtubule in the field of view (n=15 microtubules for both stimulatory and inhibitory). Microtubules within 2 μm of the cell periphery are shown in green. Inset graphs display traces from three individual microtubules. (c) The length of time (t, s) each quantified microtubule remained within 2 μm of the cell periphery in cells plated on stimulatory and inhibitory mAbs was expressed as a percentage of n microtubules (n=71 and 61 microtubules for stimulatory and inhibitory, respectively). Inhib., inhibitory; Stim., stimulatory.

