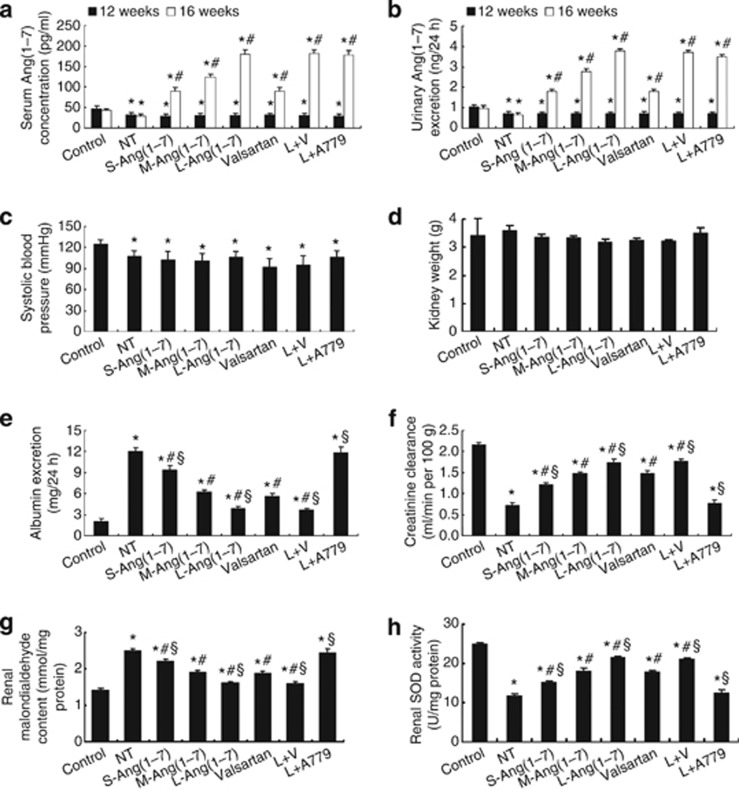
Figure 1.
Ang(1–7) levels, blood pressure, and renal function in eight groups of rats. (a) Serum levels of Ang(1–7) (n=5 per group). (b) Urinary levels of Ang(1–7) (n=5 per group); *P<0.05 vs. control group at the same time point; #P<0.05 vs. the same group at the end of week 12. (c) Systolic blood pressure. (d) Kidney weight. (e) 24-h urinary albumin. (f) Creatinine clearance. (g) Malondialdehyde content. (h) Superoxide dismutase (SOD) activity. *P<0.05 vs. the control group; #P<0.05 vs. the no-treatment group; §P<0.05 vs. the valsartan group. NT: no treatment; S-Ang(1–7): small-dose Ang(1–7); M-Ang(1–7): moderate-dose Ang(1–7); L-Ang(1–7): large-dose Ang(1–7); L+V: large-dose Ang(1–7)+Valsartan; L+A779: large-dose Ang(1–7)+ A779.

