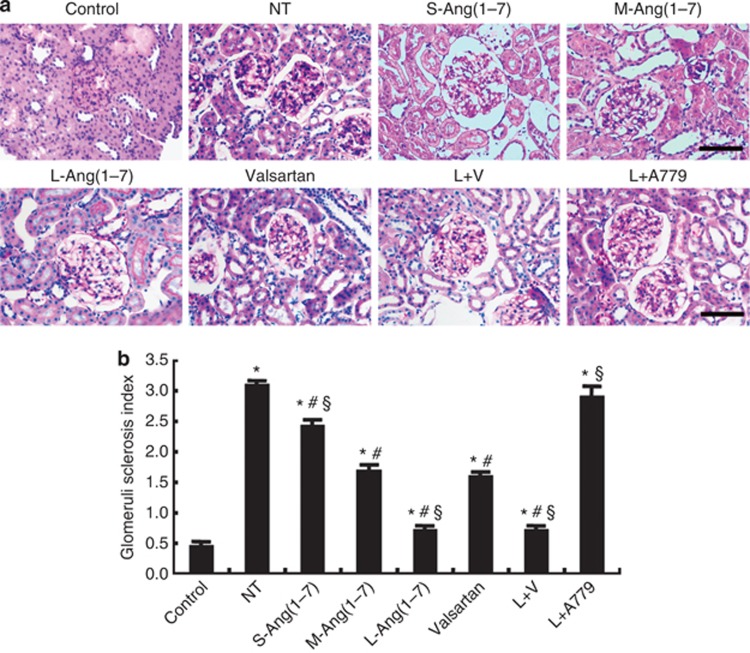
Figure 2.
Effect of Ang(1–7) and valsartan treatment on mesangial matrix expansion in eight groups of rats. (a) Representative light micrographs of periodic acid–Schiff (PAS) staining. (b) Quantification of glomeruli sclerosis index based on the amount of PAS-positive staining. Bar=50 μm. *P<0.05 vs. the control group; #P<0.05 vs. the no-treatment group; §P<0.05 vs. the valsartan group. NT: no treatment; S-Ang(1–7): small-dose Ang(1–7); M-Ang(1–7): moderate-dose Ang(1–7); L-Ang(1–7): large-dose Ang(1–7); L+V: large-dose Ang(1–7)+valsartan; L+A779: large-dose Ang(1–7)+ A779.

