
Fig. 2.
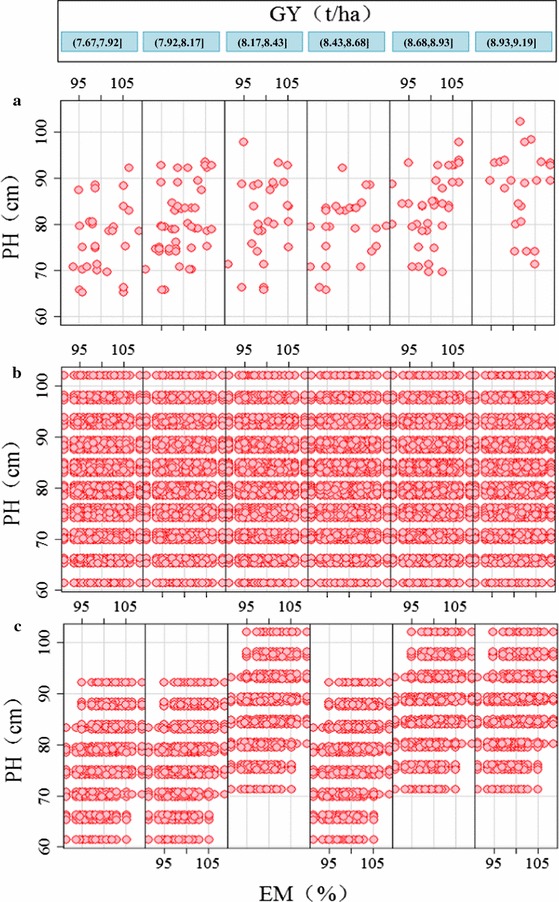
All GY, PH and EM QTL combinations present in the real Avalon × Cadenza population (a), scenario 1 (all QTL independent) (b) and scenario 2 (some QTL linkages present) (c). For Avalon × Cadenza population (a), two simulation populations in scenario 1 (b) and scenario 2 (c), plots of PH versus EM were produced conditional on the variable GY (six GY categories)