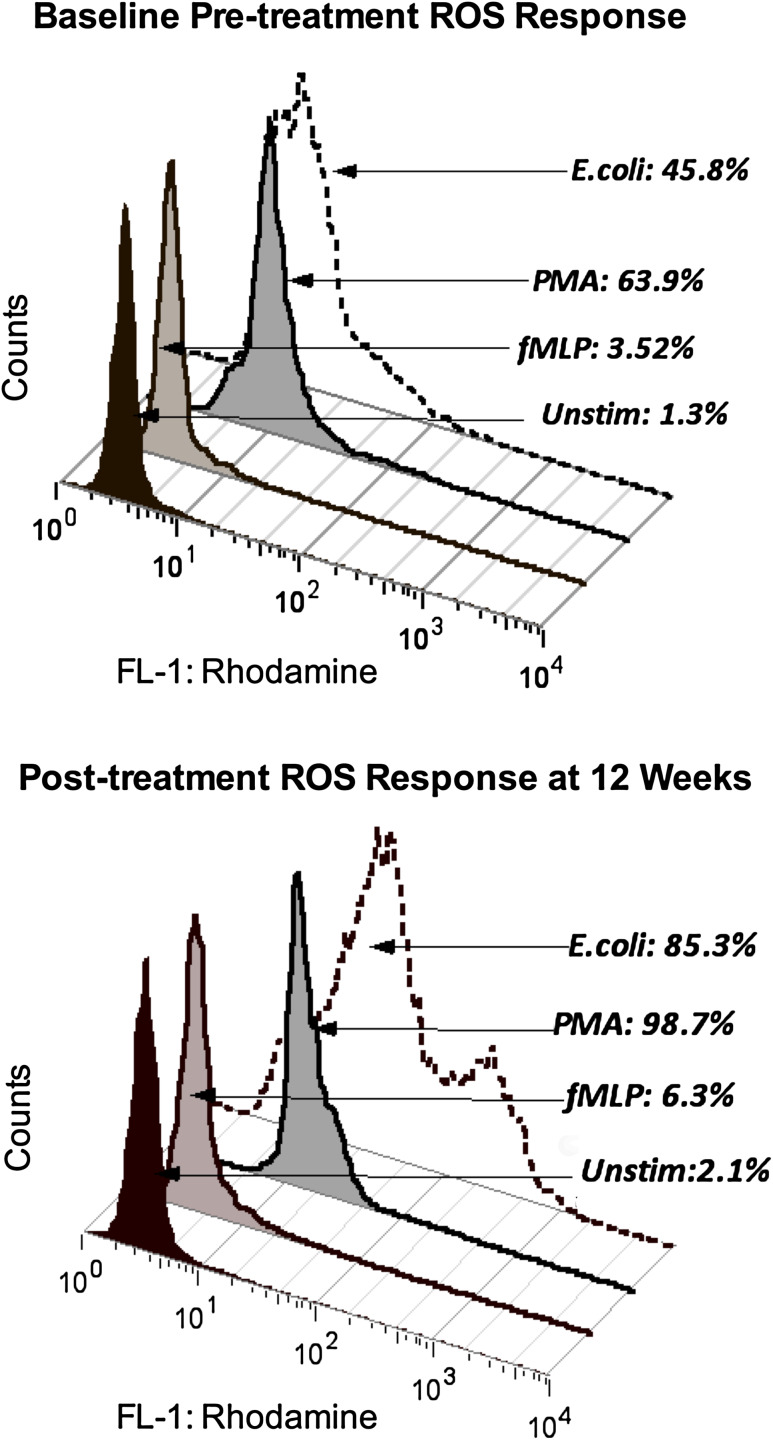
Fig. 2.
Histogram of pre- and post-treatment monocyte responses. Flow cytometry data for one representative patient shows the percentage of monocytes producing ROS after incubation of peripheral blood with fMLP, opsonized E. coli, or PMA compared with the parallel, unstimulated culture assessed ex vivo at baseline and at 12 weeks. Initial gating was performed on populations of monocytes (as distinct from lymphocytes and granulocytes) in the unstimulated cultures using CellQuest software to establish parameters for forward versus side light scatter gating. ROS activity in the unstimulated culture condition was then determined by detection of rhodamine fluorescence in the same physically gated population using the FL-1 channel (fluorescein isothiocyanate, FITC) parameter. Monocyte ROS responses to fMLP, E. coli, and PMA on each date were compared with their unstimulated response by detection of FL-1 fluorescence in the comparable physical population defined in the parallel unstimulated culture before and after Maitake treatment using FlowJo software to apply the same gate to the culture set

