
Fig. 2.
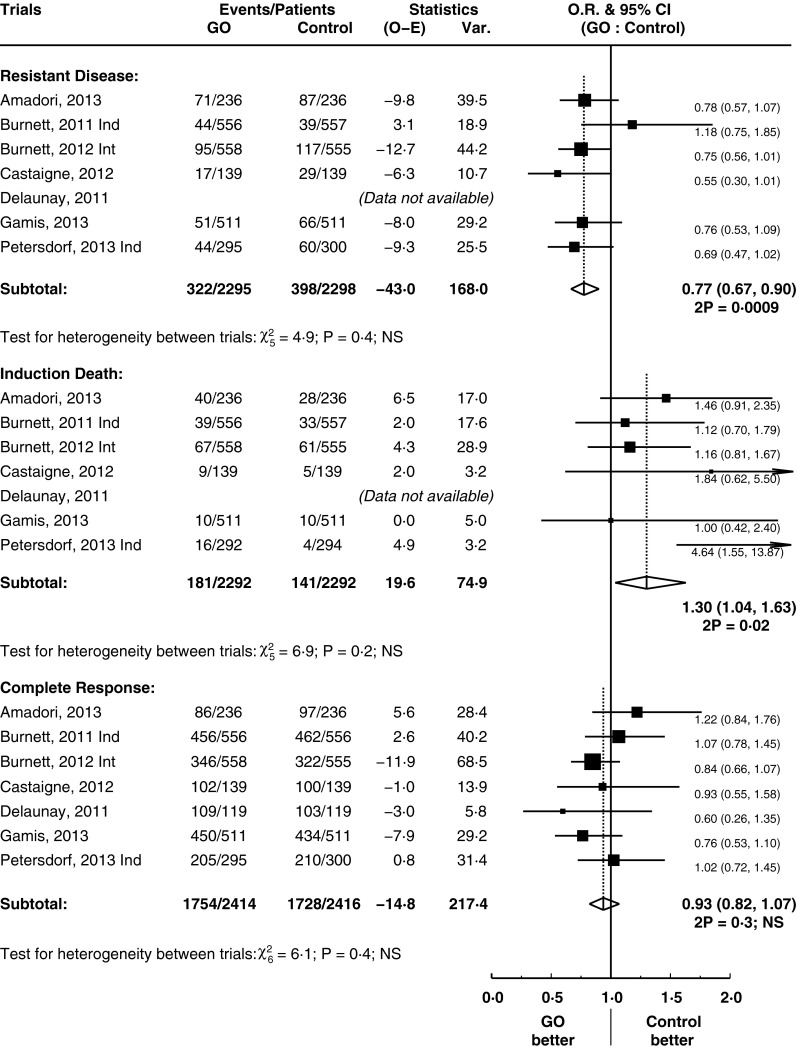
Rates of resistant death, induction death and complete remission. Forest plots (Figs. 2, 3, 4, 5, 6): black squares and horizontal lines represent estimate and 95 % confidence interval, respectively, for each study. Open diamond represents pooled estimates for each subgroup or overall outcome