


Figure 3.
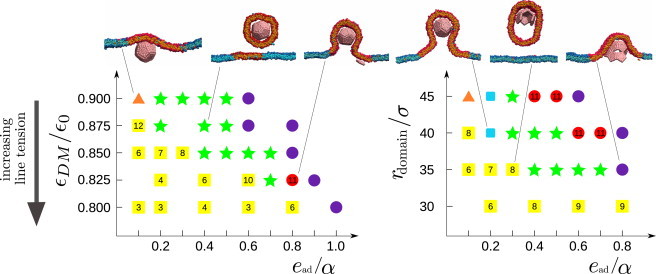
Predominant end-products from assembly simulations via quasi-equilibrium states with a membrane microdomain, as a function of adhesion strength ead and (left) line tension (γσ/kBT ≈ 22.9–24.7εDM/ε0) with fixed domain radius rdomain = 35σ and (right) varying rdomain with fixed line tension εDM/ε0 = 0.85 (γ ≈ 1.9 kBT/σ) and α = 2.276σ−2. The most frequent outcomes are indicated as complete assembly and budding (green solid stars); budding of the entire domain before assembly completes, with the number indicating the typical partial capsid size upon budding (yellow solid squares); complete assembly but incomplete wrapping (orange solid triangles); stalled assembly with wrapping (red solid circles); complete assembly and wrapping without fusion of the neck (blue squares); and malformed assembly (purple circles). Snapshots from simulations for the corresponding parameter sets are also shown. The complete distribution of outcome frequencies and assembly times are shown for some parameter sets in Fig. S11 and Fig. S12. To see this figure in color, go online.