
Figure 6.
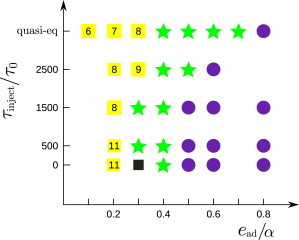
Predominant end-products as a function of the subunit injection timescale τinject and the adhesion strength ead are shown for a domain with rdomain = 25σ and γ = 1.9 kBT/σ. The most frequent outcome is shown for every set of parameters. (Symbols are defined as in Fig. 3 except for black solid square symbols, which denote budding of the whole domain with a malformed capsid inside.) Alternative outcomes observed at some parameter sets are documented in Fig. S15. To see this figure in color, go online.