
Figure 2.
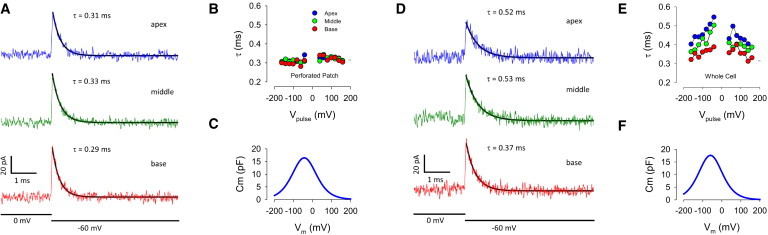
Time constants (τ) of current responses induced by step voltages of the roving loose patch electrode before (A–C) and after (D–F) rupture of recording the electrode perforated patch. (A) Traces of currents measured during apical, middle, and basal stimulation. Traces are averages (see Materials and Methods). Note that current responses have similar exponential decays. (B) Average response tau across voltage stimulation magnitude. Circles depict average responses at each voltage for 3–10 cells. (C) NLC based on average fits (see Materials and Methods). Qmax, Vh, z: 2.95 pC, −59.7 mV, 0.61. (D) Traces of currents measured during apical, middle, and basal stimulation following recording electrode patch rupture into standard whole-cell mode. Traces are averages. Note that current responses now have differing exponential decays. (E) Average response tau across voltage stimulation magnitude, showing clear voltage dependence. Circles depict average responses at each voltage. (F) NLC based on average fits. Qmax, Vh, z: 2.81 pC, −43.2 mV, 0.60. To see this figure in color, go online.