
Figure 2.
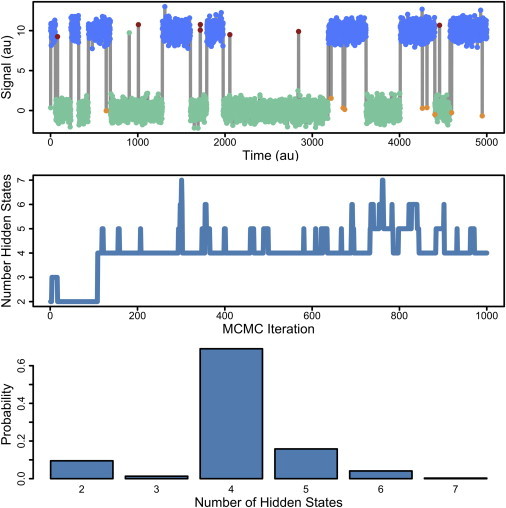
Demonstration of the iAMM. (Top) Simulated data from a four-state process with two closed and two open states with different dynamics. Each of the states differ in their exit rate—we can even tell by eye that there is a short-lived state and a long-lived state, for both open and closed. Colors correspond to the inferred state-assignments when this time series is modeled with the iAMM; we find the number of hidden states correctly and correctly label each data point. (Middle) The number of hidden states over the course of MCMC simulation. (Bottom) The posterior distribution over the number of hidden states. There is high probability that this time series was generated from a four-state process. Algorithm parameters: α = 1, γ = 1, and κ = 100.