
Figure 3.
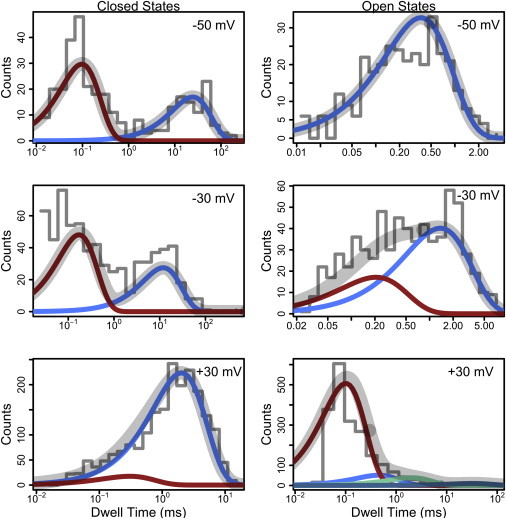
Dwell-time distributions and infinite mixture models. These dwell-times, plotted logarithmically for visualization, are from 5 s of a BK channel at 6 μM calcium and various holding voltages. Distributions of dwell-time are analyzed with an infinite exponential mixture model in order to discover how many components are in the data. The raw data are visualized in the histograms, and the probability density of each component is shown atop the histogram. Finally, the total probability density from all components is shown as the gray trace in each panel. Algorithm parameters: α = 1.