
Figure 4.
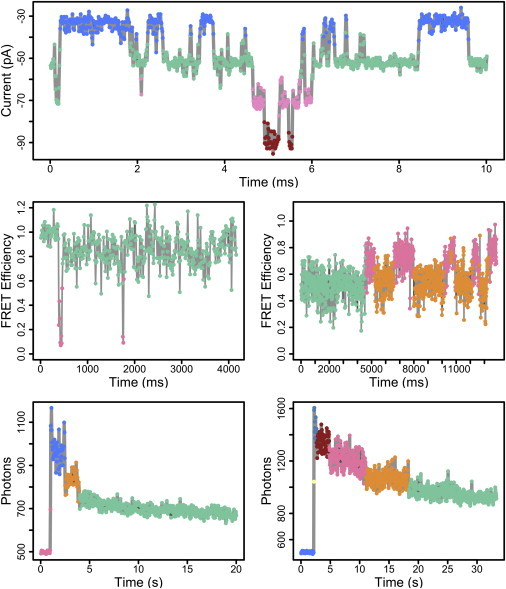
Application of iHMM to single-molecule time series. (Top) Electrophysiological recording of a patch containing multiple channels and downward current deflections indicate channel opening events. (Middle) Traces from single-molecule FRET. (Bottom) Traces from single-molecule photobleaching. In each case, the data points are colored corresponding to the hidden state from which they are likely drawn. Algorithm parameters: α = 1 and γ = 1.