
Figure 6.
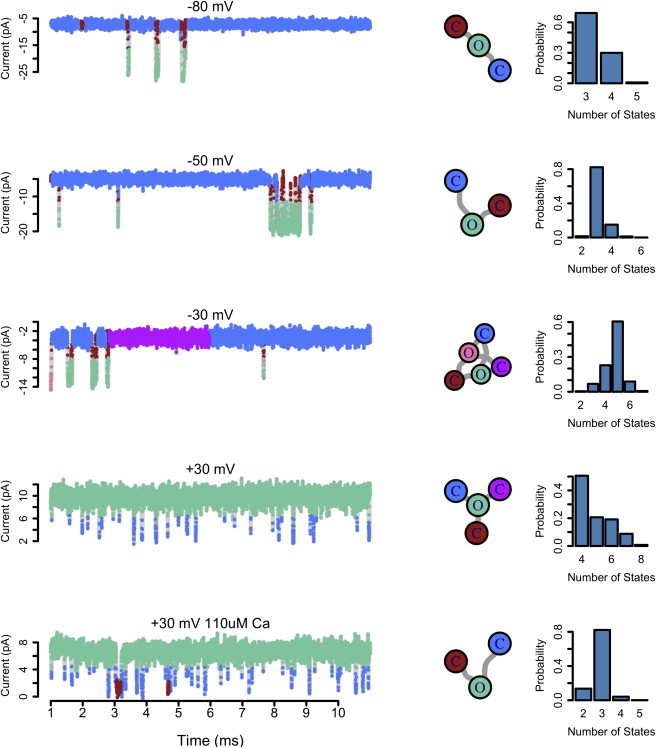
Recordings from a BK channel at multiple holding voltages and calcium concentrations analyzed using the sticky-iAMM. (Left) Data points are colored corresponding to the hidden state from which they were drawn in the inferred model. (Middle) The inferred model for each trace, visualized in Kienker uncoupled form. (Right) The posterior distribution over the number of hidden states for each trace. Algorithm parameters: α = 1, γ = 1, and κ = 100.