
Figure 6.
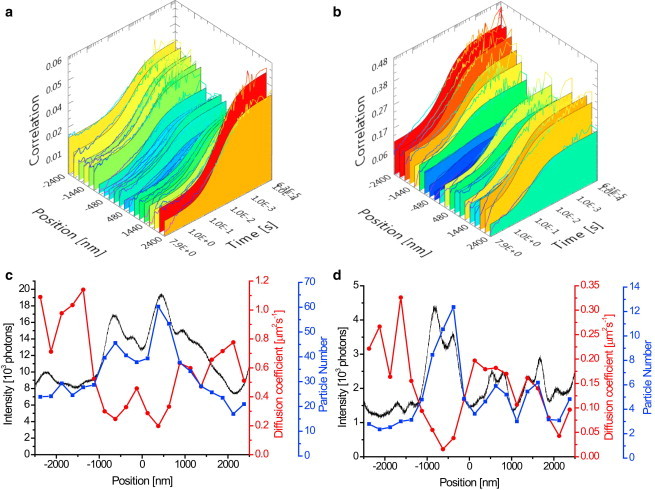
Spatially resolved LS-FCS. (a and b) Examples of temporal autocorrelation functions and their single-component fit at different points along the scanned line for DOPE-Atto647N (a) and SM-Atto647N (b) in two COS7 cells. Data were acquired at confocal resolution (640 nm excitation at 5 μW). Each of 20 curves is an average of a 250-nm-long line segment. (c and d) Typical spatial profiles of diffusion coefficients (red line) and particle numbers (blue line) obtained from single-component fits at different points along the scanned line shown in (a) and (b), and the corresponding fluorescence intensity (black line) for DOPE-Atto647N (c) and SM-Atto647N (d) in COS7 cells. To see this figure in color, go online.