
Figure 3.
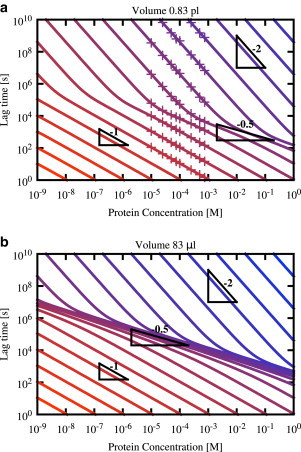
Transitions between different scaling regimes appear as kinks in lag-time versus concentration curves. Lag-time versus concentration curves predicted by Eq. 9 are plotted for a range of primary nucleation rates kn. The kn value increases top-right to bottom-left and is color-coded from kn = 10−30 M−1 s−1 (blue) to kn = 1010 M−1 s−1 (red), being increased by factors of 100. The two panels show results for different system volume V: (a) V = 0.83 pL, (approximately the size of a human cell). (b) The much larger volume V = 83 μL (a typical volume used in in vitro protein aggregation experiments). In panel a, the crosses correspond to the simulation data given in Fig. 2a. In all cases, k+ = 5 × 10⁴ M−1 s−1, kf = 3 × 10⁻⁸ s−1, and nc = 2. To see this figure in color, go online.