
Figure 5.
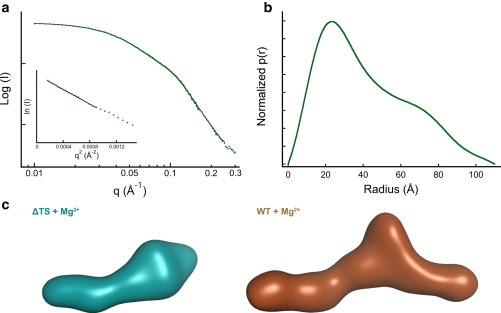
SAXS analysis of ΔTS VAI. (a) SAXS scattering curves of ΔTS VAI. The solid black line shows the fit of the data to a p(r) distribution. Inset: Guinier analysis giving Rg = 32.7 ± 1.1 Å. (c) Ab initio model of ΔTS compared to WT VAI. The bead models were generated by simulated annealing using DAMMIF (36). Twenty-five models were superimposed, averaged, and filtered using DAMAVER (37). The models were converted to surface representations using SITUS (38). To see this figure in color, go online.