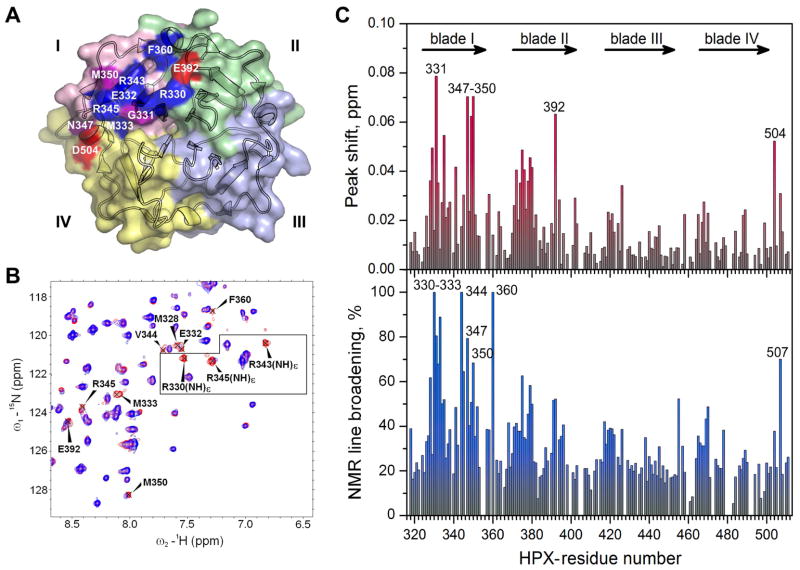
Figure 1. Perturbations of NMR spectra suggest the THP binding site on the HPX domain of MT1-MMP.
(A) The crystal structure of the HPX domain (pdb: 3c7x) (Tochowicz et al., 2011) colors blades I – IV pink, green, light blue, and yellow, respectively. THP-induced perturbations of NMR peaks are colored red where shifted, blue where broadened, and purple for both.
(B) NMR peaks in the 15N TROSY spectrum of the HPX domain affected by addition of α1(I)772-786 THP are labeled. The spectral contours of the free state are red and the bound state blue (1.5-fold molar excess of THP, pH 5, 25 °C). The box encloses arginine side chain NHε peaks, which are assigned in Figure S1D.
(C) THP-induced chemical shift perturbations (upper panel) and NMR line broadening (lower panel) are plotted versus sequence. The chemical shift perturbation is quantified as ΔωHN = (ΔωH2 + (ΔωN/5)2)1/2, where ΔωH and ΔωN are the peak shifts in ppm in the 1H and 15N dimensions. The NMR line-broadening is quantified as 1−ITHP/I0, where ITHP and I0 are the peak heights with and without one equivalent of THP.

