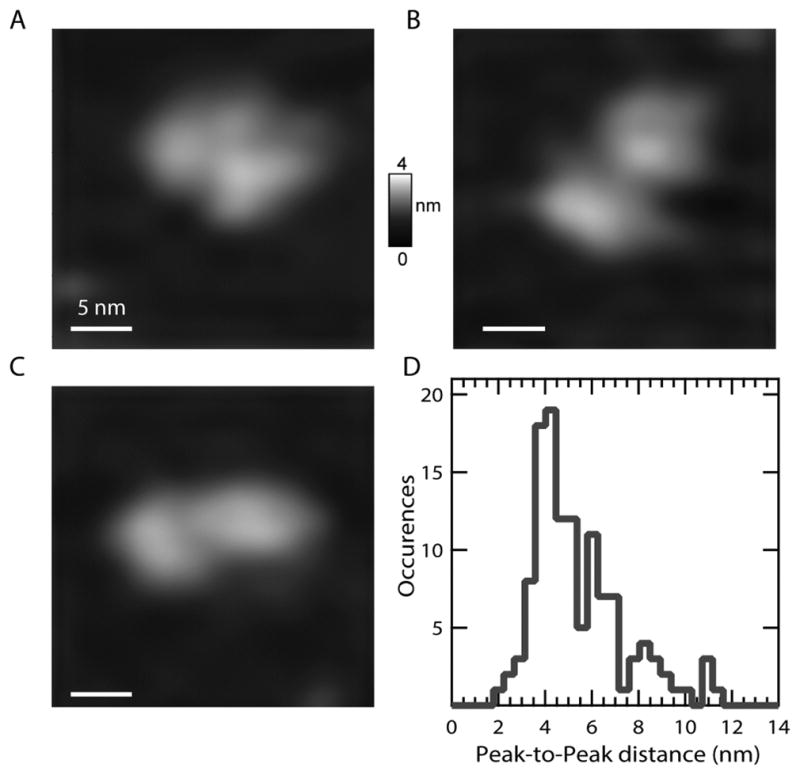
Figure 7. AFM images reveal variable distances between the catalytic and HPX domains of MT1-MMP, suggesting flexible tethering and diffusion of the domains.

(A–C) Features with distances between high points of the domains of 4.2 nm (A), 6.1 nm.(B), and 8 nm (C). The vertical scale rises to 4 nm and the lateral scale bar represents 5 nm.
(D) The histogram shows the distribution of peak-to-peak distances (N = 134 features) between high points of adjoining domains in 150 mM NaCl, 10 mM CaCl2, at pH 7.5. The bin size is 0.45 nm.
