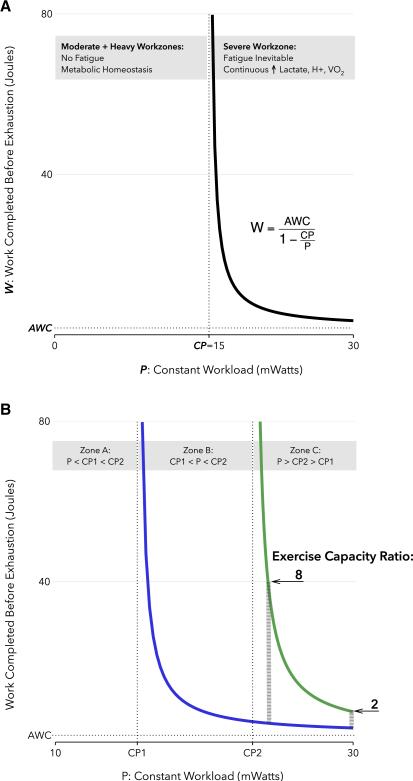
Figure 1. The Power-Work relationship and its implications for exercise testing.
(A) Power-Work relationship. During constant power exercise at a workrate of P milliWatts, the amount of work that can be completed before exhaustion (W, the exercise capacity) is a function of the parameters P, CP, and AWC. For P < CP, termed the Moderate or Heavy workzones, W is theoretically unlimited. For P>CP, termed the Severe workzone, W follows the displayed power-work relation. The example value of CP was calculated for a 25g mouse with a critical velocity of 22m/min on a 10 degree treadmill incline; AWC was set at 2 Joules. (B) Workload dependence of relative exercise capacity between two groups of mice, treatment (green) and control (blue). The ratio of exercise capacities is a function of the imposed workload, P, displayed here for 2 different values within zone C (thick grey dashed lines). It also depends on the power-work parameters of each group: CP1, CP2, and AWC. AWC is assumed equal between groups. See text for details. CP, critical power; AWC, anaerobic work capacity.

