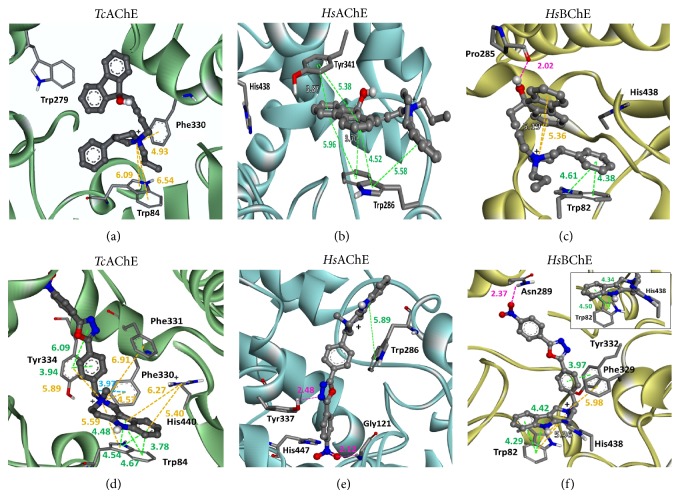
Figure 3.
The interactions between C and D compounds with TcAChE (1EA5, enzyme in green), HsAChE (1B41, enzyme in blue), and HsBChE (4BDS, enzyme in yellow) obtained after molecular docking. The compound “C” is shown in (a), (b), and (c), and the “D” in (d), (e), and (f), respectively. The nonpolar hydrogen atoms were omitted; the nitrogen atoms are represented in blue, oxygen in red, carbon in gray, and the polar hydrogen in white. The inhibitors are represented as ball and stick and the amino acids residues as sticks. The types of interactions are represented by dotted lines with their respective distance, differentiated by colors: π-π interactions (green), cation-π (orange), σ-π (light blue), and hydrogen bonds (pink).

