
Figure 2.
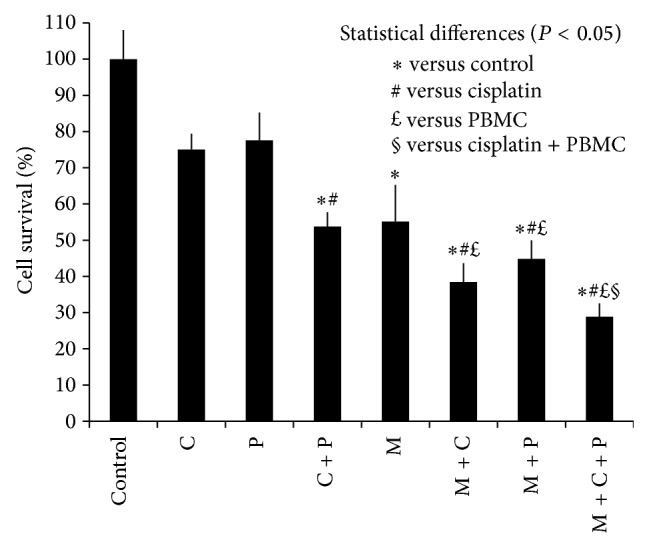
HepG2 cell survival rate after exposure to different factors for 24 hours exposure. Control = cells not exposed to any factor (negative control), C = CisPt 2 μg/mL, P = PBMCs, and M = mechanical stress. Error bars represent one standard error of the mean (P < 0.05).