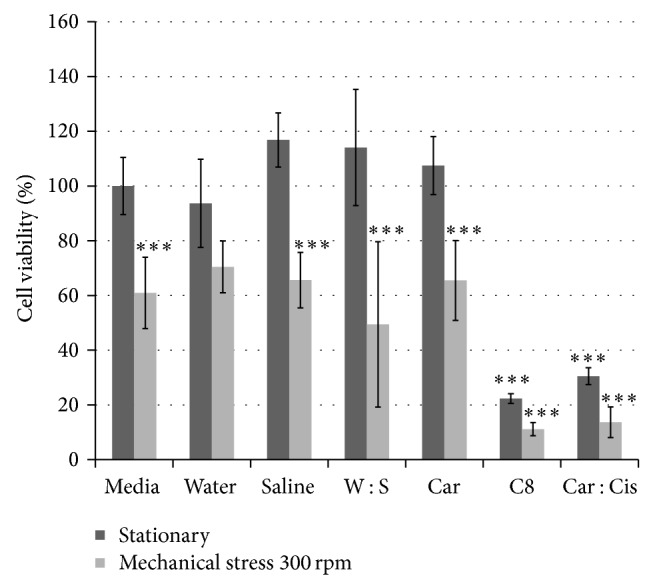
Figure 6.

Cell viability of HepG2 cells after exposure to CisPt (8 μg/mL) and carnosine (1 : 3 molar ratio) with and without mechanical shaking (300 rpm) for 24 hours as per MTT assay. The data are presented as a mean of at least three independent experiments (mean ± SD). Left to right: Media = control HepG2 cells. C8 = HepG2 cells exposed to CisPt 8 μg/mL. C : C = HepG2 cells exposed to CisPt 8 μg/mL and carnosine in 1 : 3 molar ratio. Car = HepG2 cells exposed to carnosine. Water = HepG2 cells exposed to water (carnosine control). Saline = HepG2 cells exposed to saline (CisPt control). W : S = HepG2 cells exposed to water and saline (C : C control). (Error bars represent the standard deviation.) The P values on the bars denote the significant differences as compared to the control cells that were seeded in a stationary plate and with media not supplemented with any chemical agent (*** P < 0.001).
