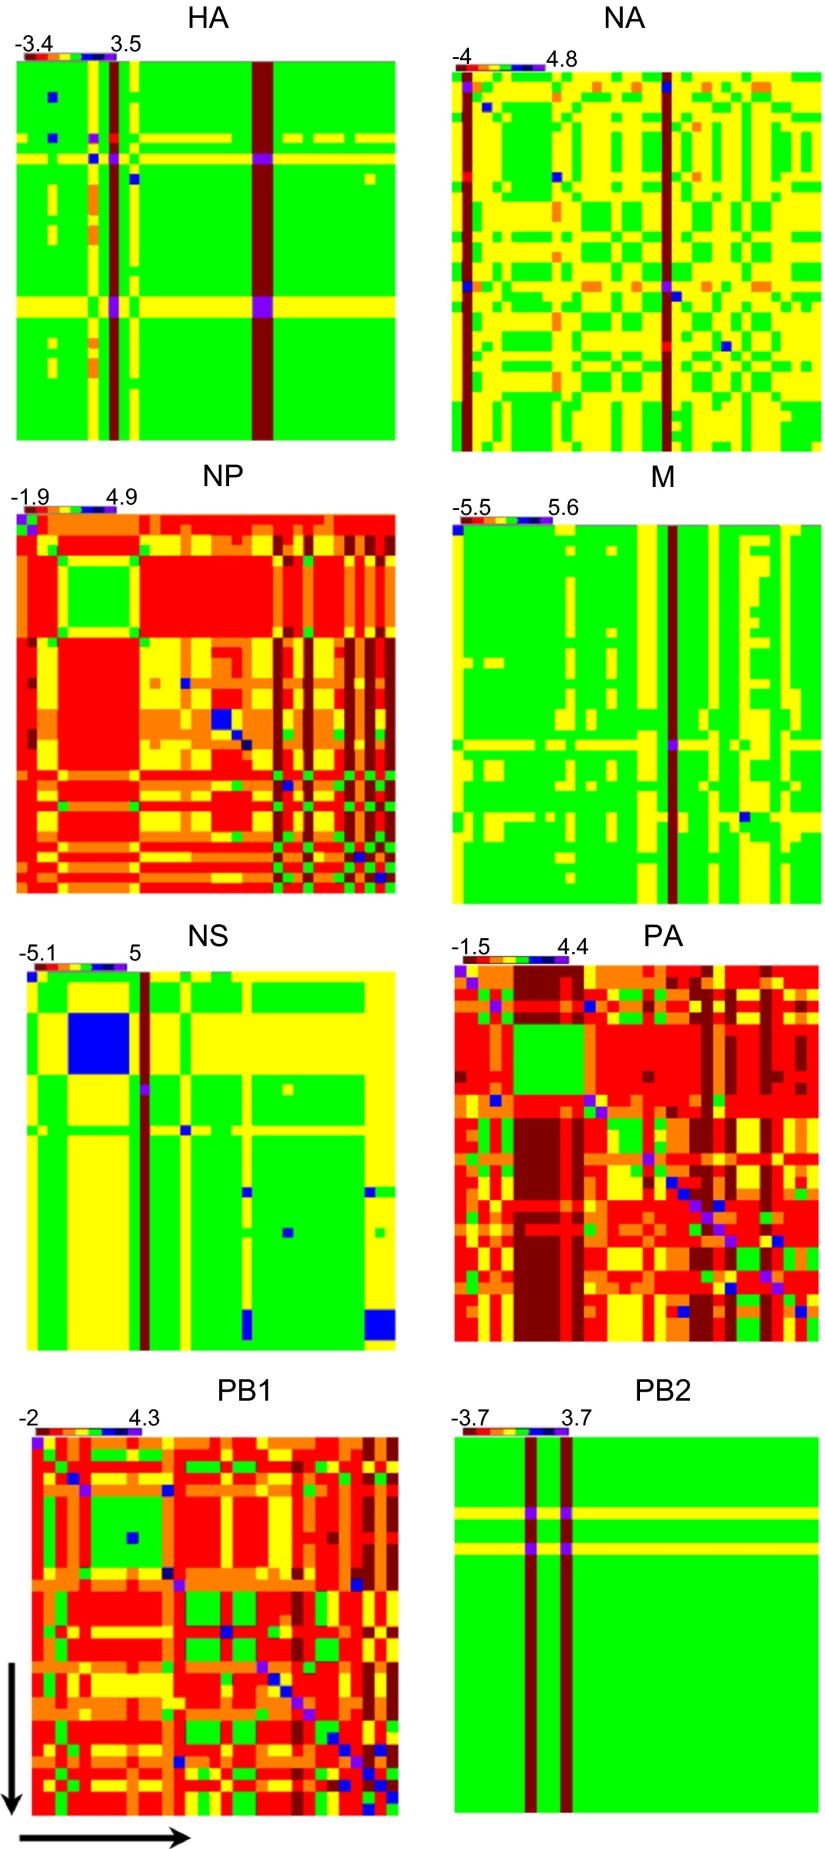
Figure 3.
Nucleotide identity matrix of individual genes from Bangladeshi H9N2 viruses. The sequence identity range is indicated in different colors and above each gene segment. The arrow shows the earliest to the latest isolation date from 2010 to 2013. Colors indicate high (green, 99%–100%), median (yellow, 96%–98%) and low relative similarities (red, 94%–95%) for each indicated gene after the sequence identity was normalized in the matrix to have a mean of 0 and variance of 1.

