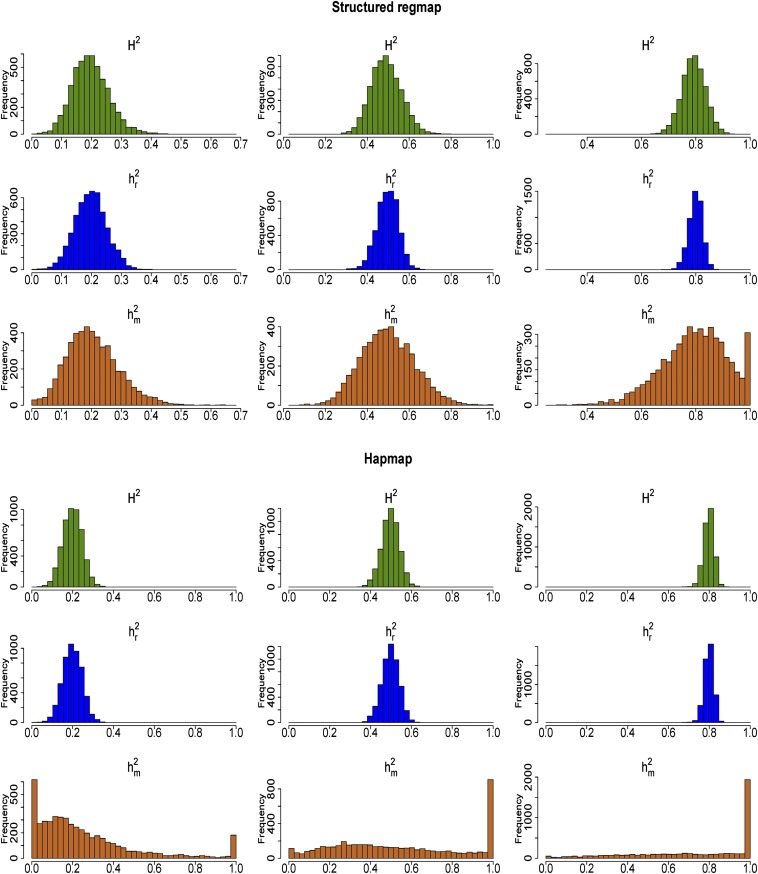
Figure 1.
Heritability estimates for 5000 simulated traits for random samples of 200 accessions drawn from the structured RegMap (top) and the HapMap (bottom). Twenty QTL were simulated, which explained half of the genetic variance. The simulated heritability was 0.2 (left), 0.5 (center), and 0.8 (right). Within each panel, the first row shows the ANOVA-based estimates of broad-sense heritability, the second row the mixed-model-based estimates based on the individual plant data, and the third row the mixed-model-based estimates based on genotypic means.

