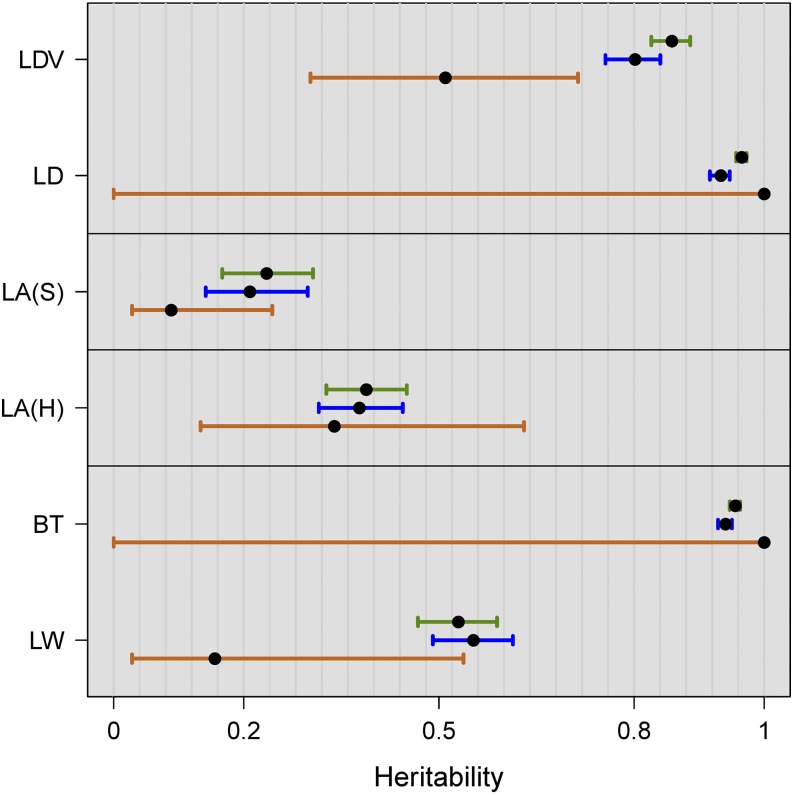
Figure 2.
Heritability estimates and confidence intervals for two flowering traits from Atwell et al. (2010) (LDV and LD) and four traits from new experiments. Three estimators were used: the ANOVA-based estimator of broad-sense heritability (, green), the marker-based estimator using individual plant data (, blue) and the marker-based estimator using genotypic means (, brown). Traits from different experiments are separated by the black horizontal lines. Trait abbreviations are given in Table 1. Confidence intervals associated with the marker-based estimates are constructed using the logarithmic transformation described in Materials and Methods.

