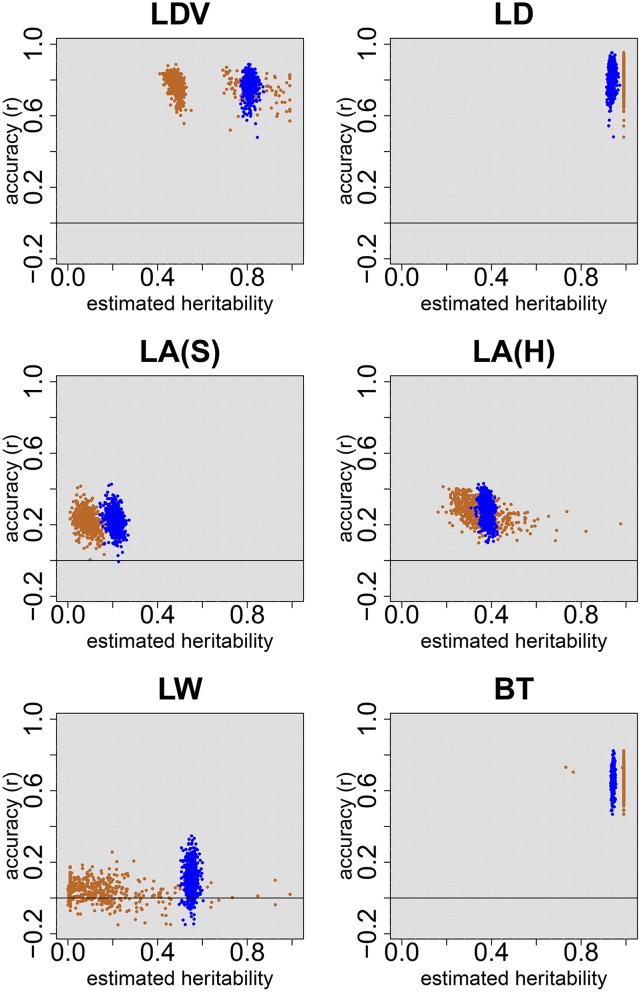
Figure 5.
Prediction accuracy (r) of G-BLUP in 500 cross-validations, for six traits observed on A. thaliana. In each cross-validation, the accessions are randomly partitioned into a training set of 80% and a validation set of 20% of the accessions. Predictions for the individual plant data for the accessions in the validation set were obtained from Equation C6 in Appendix C. The genetic effects in (C6) were estimated either using individual plant data (blue) or using genotypic means (orange).

