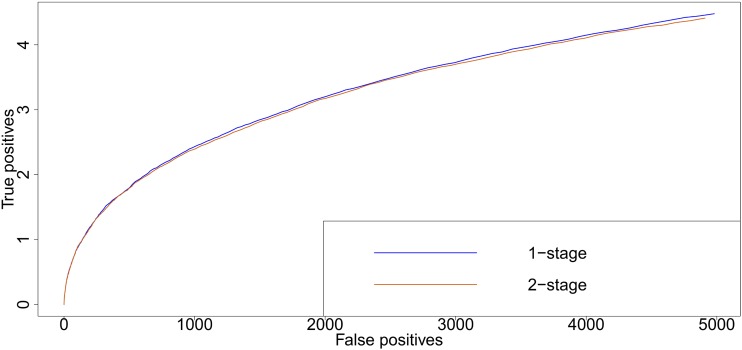
Figure 6.
Receiver operating characteristics for the GWAS simulations. One thousand traits were simulated, for random samples of 200 accessions drawn from the HapMap. Ten QTL were simulated, at randomly chosen SNP positions (see Simulations in Materials and Methods for more details). The QTL explained 75% of the genetic variance. The simulated heritability was 0.5. The curves were obtained by moving from a small (conservative) significance threshold to a larger one. Simulated QTL were counted as true positive if their P-value was below the threshold; all other SNPs below the threshold were counted as false positive.

