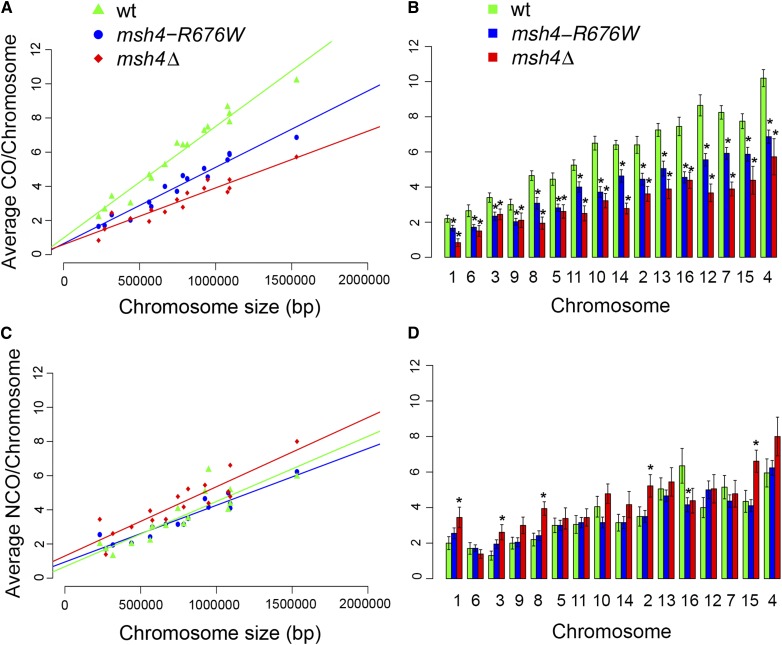
Figure 3.
Average crossover and noncrossover counts per chromosome for wild type, msh4–R676W, and msh4Δ. (A and C) Scatter plot of average crossover and noncrossover counts per chromosome against chromosome size for wild type, msh4–R676W, and msh4Δ. Best fit line is obtained through linear regression analysis. The equations for the best fit lines are: wild type (CO = 0.0000065 × chr. size + 0.98; NCO = 0.0000034 × chr. size + 0.67), msh4–R676W (CO = 0.0000045 × chr. size + 0.64; NCO = 0.0000033 × chr. size + 0.94), msh4Δ (CO = 0.0000033 × chr. size + 0.59, NCO = 0.0000041 × chr. size + 1.29). (B and D) Bar plot of average crossover and noncrossover counts per chromosome for wild type, msh4–R676W, and msh4Δ. Chromosomes (msh4–R676W and msh4Δ) with significant difference (two-tailed t-test for difference in mean; P < 0.05) in crossover/noncrossover counts compared to wild type are shown with an asterisk symbol (*). Chromosomes are ordered according to size from left to right. Error bars are mean ±SE.

