Figure 5.
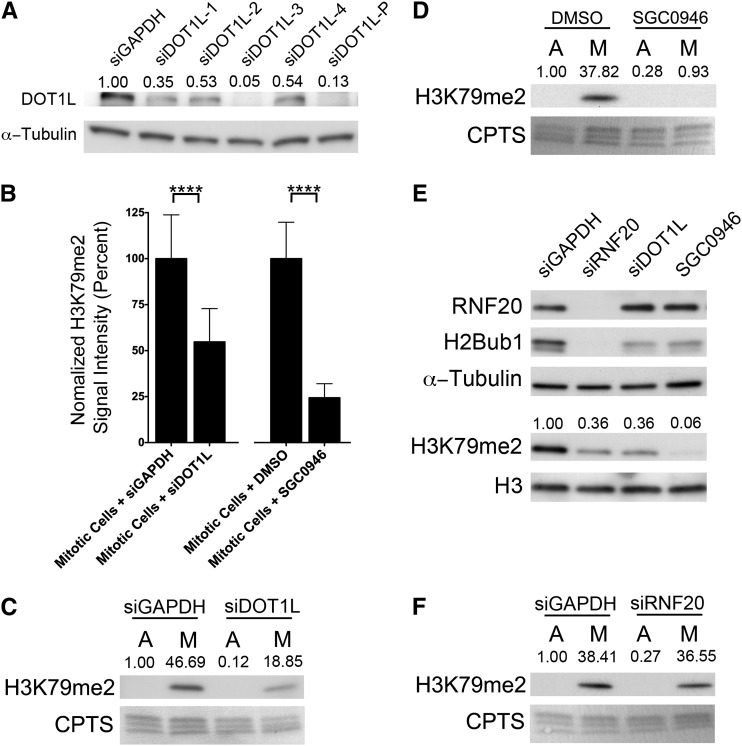
DOT1L expression and function are required for the mitosis-specific increases in H3K79me2. (A) Western blot depicting the abundance of DOT1L following silencing with either individual (siDOT1L-1 to -4) or pooled (siDOT1L-P) siRNA duplexes relative to control (siGAPDH). Semiquantitative analyses were performed and the relative abundance of DOT1L following normalization to the respective loading control (α-tubulin) is presented. (B) Bar graphs depicting the statistically significant (****P-value <0.0001) decreases in the mean, DAPI-normalized H3K79me2 total signal intensities in the DOT1L silenced (48 hr post-transfection, left) or inhibited (2 hr treatment, right) cells relative to controls. Note that only the H3K79me2 signal intensities from mitotic cells were imaged, quantified, and presented. (C) Western blots showing the global abundance of H3K79me2 within asynchronous, predominantly interphase cells (A) or mitotically enriched (M) populations of control (siGAPDH) or DOT1L (siDOT1L) silenced cells. The exposure time was optimized to display the mitotic H3K79me2 signals and not those within the asynchronous populations. Semiquantitative analyses were performed and the relative abundance of H3K79me2 following normalization to the respective loading control (CPTS) is shown. Note the large decrease in abundance of H3K79me2 within the mitotically enriched population from the DOT1L silenced cells relative to the GAPDH silenced controls. (D) Western blot depicting a large decrease in H3K79me2 levels following SGC0946 treatment (48 hr treatment) specifically within the mitotically enriched (M) population. Blots are labeled as in C. (E) Western blots of proteins harvested from asynchronous (predominantly interphase) cells depicting the relative abundance of the indicated proteins and histone PTMs following RNF20 and DOT1L silencing and SGC0946 treatment (48 hr treatment) relative to siGAPDH controls. Semiquantitative analyses were performed and the relative abundance of H3K79me2 following normalization to the respective H3 loading control is shown. Note that RNF20/H2Bub1 depletion is associated with a decrease in H3K79me2 within interphase cells, which supports the existence of a trans-histone pathway. (F) Western blot demonstrating that RNF20 silencing (siRNF20) does not affect the global abundance of H3K79me2 specifically within mitotic cells relative to controls (siGAPDH). Semiquantitative analyses were performed and the relative abundance of H3K79me2 following normalization to the respective loading control (CPTS) is shown, suggesting there is an uncoupling of the trans-histone pathway within mitotic cells.

